
MAGNETIC LOCAL TIME SURVEY OF RADIATION BELT
HELIUM ION STRUCTURE CONDUCTED WITH DATA
FROM THE POLAR CAMMICE/HIT INSTRUMENT
W. N. Spjeldvik, T. A. Fritz, R. B. Sheldon and J. Chen
Boston University Center for Space Physics
725 Commonwealth Av, Boston, MA 02215
October 1997
A study of geomagnetically confined helium ions in the range
0.52--8.2 MeV ion kinetic energy was made with the CAMMICE Heavy Ion
Telescope (HIT) during April--October 1996. Much of the year 1996 was
remarkably geomagnetically quiescent with absence of major magnetic
storms, large shock transits through the magnetosphere, or penetration
injection events. Indeed, between two minor magnetic ``storms'' on
January 13 (D_ST} minimum ~ -88 nT) and October 23 (Dst minimum
~ -110 nT) 1996 there was a long geomagnetically relatively
undisturbed time period with Dst excursions in the few tens of nT at
most. Using the POLAR ephemeris data, it was found that the nominal
L-parameter location of the radial peaks in helium ion fluxes varied
considerably with azimuthal location around the Earth, i.e., with
magnetic local time (MLT), to be observed at L=2.7--2.6 respectively in
the dawn sector (near MLT~5 hr) and typically a nominal
L-parameter farther out in the dusk sector (near MLT~17 hr). The
empirical helium ion anisotropy could be reasonably approximated by an
unambiguous \sin^n \alpha_0 dependence (where \alpha_0 is
equatorial pitch angle) only fairly close to the geomagnetic equator,
at equatorial pitch angles \alpha_0 > 45deg. For smaller
equatorial pitch angles, the distribution was often seen to be flatter
than describable by this relation alone. There may be several
interacting causes of these observed features, including (1) effects
of differences between the real geomagnetic field and the model field
(IGRF 95) used in the POLAR ephemeris, (2) consequences of coupling
between ion transport dynamics, spectra and exospheric interactions,
and (3) possibly also real physical effects of the azimuthally
asymmetric geoelectric field in conjunction with large gradients in
the helium ion distribution function. Further work is needed to
delineate the relative importance of these influences on the structure
of radiation belt helium ions.
Over the preceding decades there have been several studies of
geomagnetically trapped energetic helium ions [Tverskoy71,
Cornwall72, Krimigis76, Fritz78, Fritz79, Fritz82,
Panasyuk81, Spjeldvik78, Spjeldvik81, Spjeldvik83, Sheldon93,Chen94,
Chen96a, Chen96b, Selesnick96, Pugacheva96]. From these works we have
obtained valuable data on the radial structure and spectral
characteristics on MeV helium ions, and there have been theoretical
and experimental summaries [Schulz74, Spjeldvik79,
Spjeldvik85]. For radiation belt protons, there exist empirical
models compiled by NASA as well as a survey of proton pitch angle
anisotropies with local time, energy and L-shell
[Garcia85]. But for radiation belt helium ions, detailed
data to carry out a local time variation assessment have until now not
been available.
As a part of the International Solar Terrestrial Physics (ISTP) and
Global Geophysics Study (GGS) Programs, the POLAR spacecraft was
launched on February 24, 1996 from Vandenberg Air Force Base in
California and achieved a polar orbit with perigee below 2 earth
radii over the Earth's south pole and apogee above 8 earth radii over
the north pole. The spacecraft spins on a time scale of six seconds
with a spacecraft spin axis orientation such that instruments with
pointing direction perpendicular to the spin axis nominally samples
all directions to the geomagnetic field in each spin as POLAR crosses
the geomagnetic equatorial plane.
Amongst the extensive instrumentation on the POLAR spacecraft is the
CAMMICE instrument package which contains the Heavy Ion Telescope
(HIT) consisting of a stack of solid state detectors. It is mounted
perpendicular to the spacecraft spin axis, and it is operating with a
temporal resolution of 16 sector samples per spin period (i.e., with
an angular sampling resolution of 22.5deg) and an aperture
opening angle of +/-8deg. We here report observations of
geomagnetically trapped helium ions in four energy ranges from
0.52--8.2 MeV. These are specified in Table 1. The geometric factor of
the CAMMICE/HIT instrument is g = 9.1e-3 cm^2-sr
Fritz97. The coincidence channels, HID7 and HID8, are largely
free of background contamination. The HID5 channel will see pile-up
protons in addition to helium ions. The threshold for that channel
requires that 0.52 MeV be deposited in the detector in order to
trigger the alpha 1 threshold. One can estimate the pileup counts by
determining the flux of 260 KeV protons, apply the geometric factor to
that flux, and compute an equivalent counting rate, r. The pile up
count rate for HID5 should be equal to 5e-7 r^2. So if
r = 1000 proton counts/sec one should have about 0.5 counts/sec of
background in that helium channel. Effects of particle penetration
through the backside of the detector would also require penetration
through the entire POLAR spacecraft and can reasonably be neglected.
TABLE 1: Helium Ion Channels
| Passband |
Energy |
Particle |
| ID |
Range |
Species |
| HID-5 |
0.52-1.15 |
Helium+pileup H+ |
| HID-6 |
1.15-1.80 |
Helium |
| HID-7 |
1.80-2.40 |
Helium |
| HID-8 |
2.40-8.20 |
Helium |
The first half year of the POLAR spacecraft operations afforded an
extended period of geomagnetic calm that lasted from the time of the
spacecraft launch to October 23, 1996 when a modest geomagnetic storm
(as indicated by the provisional Dst-index depression to -110 nT)
occurred. We thus posses an extensive database on geomagnetically
confined helium ions and other ion species for the non-disturbed
radiation belts during sunspot minimum conditions. Figure 1 shows a
typical trajectory (on July 28, 1996) of the POLAR spacecraft through
the Earth's magnetosphere. At that time the orbital plane was close
to the dawn-dusk plane, and the trajectory also closely coincided with
the nominal plane of the geomagnetic field lines.

FIGURE 1: Orbit of the POLAR spacecraft in
Solar-Magnetospheric (SM) coordinates during July 28 (day 210) 1996.
Numbers on the trajectory trace indicate hour of the day of the
spacecraft location.
An example of the data from the four helium ion detector passbands
listed in Table 1 is shown in Figure 2. These data are from July 28,
1996 with the left side panels depicting the observed distribution of
the helium ion flux with the L-parameter in the geomagnetic dusk
sector (MLT ~ 17 hr) and the right side panels showing the
corresponding data from the dawn sector (MLT ~ 5 hr). In both
cases, the regions of the peak ion fluxes (L ~ 2.8 to 3.6) were
sampled close to the geomagnetic equator. Since the structures of the
flux distributions show significant dawn-dusk differences, it is
worthwhile to explore whether these are related to temporal
variations, or to other more persistent causes in the heart of the
Earth's radiation belts.
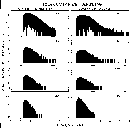
FIGURE 2: Helium ion flux
observed with POLAR in data channels HID5--8 on July 28, 1996. Left
panels: UT=14:45--16:30 (dawn sector: MLT~5 hr); Right panels:
UT=18:00--19:45 (dusk sector: MLT~17 hr). The length of the
vertical black bars indicate the spacecraft spin induced variation
in the pitch angles (essentially full range) observed.
In order to make a comparison between POLAR spacecraft observations
made in different magnetic local time sectors, we map the locally
observed ion fluxes to the geomagnetic equatorial plane. Previous
work suggests that a mapping following an assumed relation:
j(alpha0) = j(alpha_0=pi/2) \sin^n\alpha0
-- where j represents
differential helium ion flux and \alpha_0 is equatorial pitch angle
-- serves as an approximate descriptor of geomagnetically trapped MeV
helium ion anisotropy in the interior of the trapping region. Here
the anisotropy parameter, n, is empirically determined from the data
set. Under this assumption the equatorially mirroring helium ion flux
in our energy range is given by:
j0(alpha0=pi/2) = j(alpha=pi/2) (B/B0)^{n/2}
where subscript-0 denotes equatorial
quantities; j(alpha=pi/2) is the locally mirroring ion flux at
the POLAR spacecraft location where the magnetic induction value is
B; and B0 is the equatorial magnetic induction on the same
geomagnetic field line.
Since we cannot simultaneously measure both B and B_0 with one
spacecraft, it is necessary to take the B/B_0-ratio from a magnetic
field model. Well within the interior of the radiation belts and for
observations close to the equatorial plane, we used the simple dipole
ratio:
B/B0 = \sqrt{4 - 3 \cos^2 \lambda}/cos^6\lambda
where \lambda is the instantaneous
geomagnetic latitude of the spacecraft. Clearly, this should not be
relied on for L-parameters outside the geostationary orbit distance or
for far off-equatorial locations. We proceeded to determine the
anisotropy n-values from least-mean-square fits to the local pitch
angle distributions. Since the actual equatorial ion pitch angle
distributions may differ from the power-sinusoidal-type relationship,
such fits may well not be meaningful if the POLAR spacecraft is
substantially away from the geomagnetic equator. Based on empirical
information from the pitch angle distribution shapes we concluded that
the fits must be limited to those near-equatorial POLAR orbital
segments where B/B0 < 2.
Figure 3 illustrates the deduced radial profiles of the mapped
equatorially mirroring fluxes of helium ion on July 28, 1996. The
left side panels show dawn sector fluxes (MLT ~ 5 hr) in the four
energy passbands, and the right side panels show the dusk sector
results (MLT ~ 17 hr). The data coverage extends from the lowest
IGRF 95 ephemeris L-parameter observed by POLAR out to L=7. One
notices that the radial profiles show some apparent dawn-dusk
asymmetry both in ion flux magnitude and in the details of the radial
structure.
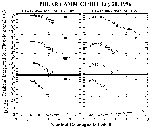
FIGURE 3: Binned
averages of POLAR observed local helium ion flux (diamond) and
equatorially mapped flux (*) in helium channels HID5--8.
Shown are for UT=14:45--16:30 dusk sector, and for UT=18:00--19:45
dawn sector passes. The bottom panels depict the B/B0-ratios of the
orbital spacecraft location.
For these two orbital cuts through the radiation belts we also display
how the anisotropy index, n, was found to vary with the L-parameter.
The left side panels in Figure 4 show the dawn results and the right
side values are for the dusk sector. Again we notice a significant
difference between the two local time sectors. In the dawn sector one
deduces anisotropy index values that are largely monotonically
increasing with decreasing L in to L~2.5 (the lowest L-parameter
encountered in that sector). However, in the dusk sector there are
indications of non-monotonic n-index radial profiles, such that the
helium ion pitch angle anisotropy appeared to be largest at L~5,
at least for energies of typically 0.52--1.8 MeV.
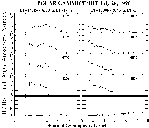
FIGURE 4: Binned averages
of POLAR observed local helium ion pitch angle anisotropy index, n,
in POLAR data channels HID5--8. For UT=14:45--16:30 a dusk sector
pass is depicted, and for UT=18:00--19:45 it is a dawn sector pass.
The bottom panels show the spacecraft's proximity of the magnetic
equator.
These results are not limited to the particular day (July 28, 1996) of
the sample data. Similar results were also found for other POLAR
spacecraft orbits both during the months preceding and the months
following this study. Since large magnetic local time variations at
MeV energies were not anticipated so deep within the trapping region
during extended geomagnetically quiescent conditions, a more extensive
survey of the helium ion azimuthal asymmetry features appeared
warranted. The quiet time study was then extended to 40 POLAR
spacecraft close-equatorial trajectories during April through October
1996 where the precession of the spacecraft orbital plane (in
GSE-coordinates) permitted all magnetic local times to be sampled.
It was first necessary to test whether or not there might be temporal
evolutionary trends in the helium ion flux data. If present, such
trends might obscure a study of flux variations with magnetic local
time based on the slow precession of the POLAR spacecraft over several
months. Two characteristic features of the helium ion flux
distributions were selected for display: the radial location of the
observed helium ion flux peak (typically found near L~3 in our
energy range) and the flux intensity magnitude of that peak. Figure 5
shows the L-parameter location radiation belt peak fluxes versus
universal time (in decimal day of the year 1996) using one sample data
channel (HID7 at 1.8--2.4 MeV), and it is found that there is only a
very modest organization of the data and exhibiting almost two L-units
spread when plotted versus universal time. Our other helium ion data
channels show the same features.
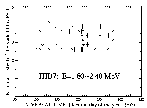
FIGURE5:
Binned averages of the radial location of the peak in the helium ion
differential flux intensity (using \Delta L=0.25) plotted versus universal
time (decimal day of the year 1996) in POLAR data channel HID7.
Figure 6 shows the corresponding result (also in data channel HID7)
for the flux intensities at the radial maxima. Diamonds depict the
locally observed fluxes (on orbit segments close to the geomagnetic
equator), and asterisks represent the equatorially mapped flux values.
Similar to the display in Figure 5, it is here seen that there appears
to be a rather limited organization of the data, and we find a spread
by about an order of magnitude of the flux peak intensity when plotted
versus universal time.
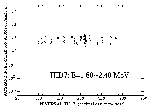
FIGURE 6:
Radial location of the peak in the helium ion differential flux
intensity plotted versus universal time (decimal day of the year
1996) in POLAR data channel HID7. Diamonds depict the observed
fluxes and asterisks show the equatorially mapped flux intensity.
The outstanding result of this exercise is clearly that there is no
systematic temporal trend in the data within the sampling resolution,
and we are not observing a helium ion distribution with
characteristics that change significantly over the six month period of
our data set. Specifically, there is no observed long-term flux
decay. This apparent stability feature of the geomagnetically trapped
MeV helium ion fluxes permits further analysis based on the overall
steady state assumption.
To further study systematic trends in the azimuthal distribution of
the helium ion fluxes around the Earth, we plotted two parameters of
the distribution, the radial location of the flux peak and the
observed flux intensity of that peak versus magnetic local time. The
results are depicted in Figure 7 and in Figure 8 using all the four
POLAR spacecraft helium ion energy channels HID5--8. The vertical bars
in Figure 7 indicate the L-parameter range used to bin the data
(\Delta L=0.25). This figure shows that there exist systematic
asymmetries in the energetic helium ion fluxes, and that these are
indeed dawn-to-dusk asymmetries that are repeatedly observed, at least
when plotted versus the POLAR spacecraft ephemeris parameters. One
can see that, compared to an azimuthal average radial location, the
MeV helium ion flux peak location in L-parameter is shifted inward
(towards the Earth) by about half a unit in the dawn sector
(MLT~1--12 hr) and is shifted outward by a similar amount in the
dusk sector (MLT~13--24 hr), leaving a dawn-dusk asymmetry of at
least a full unit L-parameter wide. This is true in all our four
energy channel.
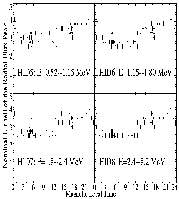
FIGURE 7:
Organization of the L-shell location of the radial peak in the
helium ion distribution observed by the POLAR spacecraft. Binning
into \Delta L=0.25 bins was used, and the data are given for channels
HID5--8 versus magnetic local time during the geomagnetically
quiescent period April -- October 1996.
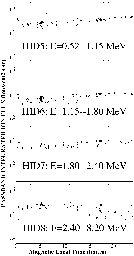
FIGURE 8:
Organization of the radial peak flux intensity in the helium ion
distribution observed by the POLAR spacecraft. The data are given
for channels HID5--8 versus magnetic local time during the
geomagnetically quiescent period April -- October 1996.
The peak flux intensities at the radial maximum location appears not
to follow quite the same simple dawn-dusk asymmetry pattern. The
result in Figure 8 depicts a general increase in flux intensity from
very early dawn (MLT~1--6 hr) towards late dusk (MLT~18--24
hr). This trend is fairly clear in channels HID5--6 (E ~ {0.52--1.8}
MeV), is weaker in channel HID7 (E~1.8--2.4 MeV), but appears
reversed in channel HID8 (E~2.4--8.2 MeV). This trend reversal
with helium ion energy is suggestive of a possible azimuthal
distribution dependence related to distribution function gradients.
It has been found that with the POLAR spacecraft ephemeris computed
from the IGRF 95 model magnetic field, azimuthal asymmetries appear to
be present in quiet time, steady state helium ion distributions at
0.52--8.2 MeV such that in the dawn sector the peak of the radial
profiles in MeV helium ion distributions is displaced towards the
Earth. The energetic helium ion flux intensities are also higher in
this local time sector at E~0.52--1.8 MeV and lower at
E~2.4--8.2 MeV. Although perfect azimuthal symmetry of
geomagnetically confined particles should not be expected around the
Earth, the finding that multi-MeV heavy ions seem to exhibit
substantial MLT-variations was not fully expected.
It is possible that some of the reported asymmetry results could stem
from differences between the real geomagnetic field (as experienced by
the trapped particle populations) and the model magnetic field used to
compute the L-parameter, magnetic latitude and longitude. The
internal contributions to the geomagnetic field include the effects of
an offset dipole, quadrupole, octopole and higher multipole
contributions that increase in importance closer to the Earth.
Apparent asymmetries resulting from this internal effect should
correlate with the planet's rotation, and not predominantly with MLT.
Imperfections in the model geomagnetic field used to compute the POLAR
ephemeris may be a more significant contributor to MLT asymmetries,
and these aspects warrant further exploration.
In addition to possible problems with the spacecraft ephemeris
determination, there may also be physical causes of azimuthal
asymmetries. The geoelectric field is known to cause L-shell
splitting effects [Roederer70, Roederer71, Stern71,
Schulz72, Kivelson75a, Kivelson75b], and the observed azimuthal
asymmetry of MeV helium ions may in part be associated with the
geoelectric field structure. It is, of course, unlikely that the
dawn-dusk electric potential drop (of the order of 50 kV) would have
bulk effects on MeV ions. This notwithstanding, some of the observed
asymmetries could be the result of the large spectral and spatial
gradients found in the trapped ion fluxes combined with the rather
modest dawn-dusk geoelectric field, so that even a small shift in the
energy spectrum may appear as a significant flux variation seen with
instruments of fixed thresholds for detection. Future modeling of
these aspects (with and without asymmetric geomagnetic and geoelectric
field topology) appears desirable to see if such an interpretation has
any merit.
This work was supported in part by a NASA grant NAG5-2578 to
Boston University for data processing and analysis. The authors are
grateful to the entire POLAR spacecraft technical management team for
data acquisition and routine processing. One of us (WNS) enjoyed the
Visiting Scholar guest privileges and hospitality at Boston University
during his sabbatical leave from Weber State University. We also want to
acknowledge the significant contributions of Bryan Laubscher, Robert
Hedges, Rose Vigil, and Gina Lujan on the CAMMICE/HIT sensor
system at the Los Alamos National Laboratory; of Rocky Koga, Patricia
Lew, Norman Katz, and Bill Crain on the HIT data processing unit at the
Aerospace Corporation; and of the administrative support and interest
provided by Donald D. Cobb at the Los Alamos National Laboratory.
-
Chen, J., Guzik, T. G., Sang, Y., Wefel, J. P., and Cooper, J. F., Energetic
helium particles trapped in the magnetosphere, Geophys. Res. Lett.,
21, 1583--1586, 1994.
-
Chen, J., Guzik, T. G., Wefel, J. P., Pyle, K. R., and Cooper, J. F., Energetic
helium isotopes trapped in the magnetosphere, J. Geophys. Res.,
101, 24787--24799, 1996.
-
Cornwall, J. M., Radial diffusion of ionized helium and protons: A probe for
magnetospheric dynamics, J. Geophys. Res., 77, 1756, 1972.
-
Fritz, T. A. and Spjeldvik, W. N., Observations of energetic radiation belt
helium ions at the geomagnetic equator during quiet conditions, J.
Geophys. Res., 83, 2579--2583, 1978.
-
Fritz, T. A. and Spjeldvik, W. N., Simultaneous quiet time observations of
energetic radiation belt protons and helium: The equatorial a/p ratio near 1
{MeV, J. Geophys. Res., 84, 2608--2618, 1979.
-
Fritz, T. A. and Spjeldvik, W. N., Pitch angle distributions of geomagnetically
trapped {MeV helium ions during quiet times, J. Geophys. Res.,
87, 5095, 1982.
-
Blake, Fennell, and Koga]{Fritz97}
Fritz, T. A., Daglis, I. A., Livi, S., Sommer, H., Wilken, B., Grande, M.,
Hall, D. D., Blake, J. B., Fennell, J. F., and Koga, R., The {POLAR CAMMICE}
investigation, Tech. rep., Center for Space Physics, Boston, 1997.
-
Garcia, H. A. and Spjeldvik, W. N., Anisotropy characteristics of
geomagnetically trapped ions, J. Geophys. Res., 90, 347,
1985.
-
Kivelson, M. G. and Southwood, D. J., Local time variations of particle flux
produced by an electrostatic field in the magnetosphere, J. Geophys.
Res., 80, 56--65, 1975.
-
Kivelson, M. G. and Southwood, D. J., Note on the electric splitting of drift
shells, J. Geophys. Res., 80, 3525--3527, 1975.
-
Krimigis, S. M. and {Van Allen, J. A., Geomagnetically trapped alpha
particles, J. Geophys. Res., 81, 2275, 1976.
-
Lemaire, J. F., ed., Modeling He and H Isotopes in the Radiation
Belts, vol. Geophysical Monograph 97, Washington, D.C., American
Geophysical Union, 1996.
-
Panasyuk, M. I. and Vlasova, N. A., Anisotropy of fluxes of protons and alpha
particles with energies greater than 4 MeV in the radiation belts,
Cosmic Res., 19, 52, 1981.
-
Pugacheva, G. I., Gusev, A. A., Martin, I. M., Spjeldvik, W. N., and Kohno, T.,
The temporal evolution of 3-9 MeV/nucleon He flux trapped in the
magnetosphere, Geophys. Res. Lett., 23, 2793--2796, 1996.
-
Reeves, G. D., ed., Geomagnetically Trapped Energetic Helium Nuclei,
vol. 383, New York, American Institute of Physics, 1996.
-
Roederer, J. G., Dynamics of Geomagnetically Trapped Radiation,
Springer Verlag, New York, 1970.
-
Roederer, J. G. and Schulz, M., Splitting of drift shells by the magnetospheric
electric field, J. Geophys. Res., 76, 1055, 1971.
-
Schulz, M., Drift shell splitting at arbitrary pitch angle, J. Geophys.
Res., 77, 624, 1972.
-
Schulz, M. and Lanzerotti, L. J., Particle Diffusion in the Radiation
Belts, Springer Verlag, New York, 1974.
-
Sheldon, R. B. and Hamilton, D. C., Ion transport and loss in the Earth's
quiet ring current: 1. data and standard model, J. Geophys. Res.,
98, 13491, 1993.
-
Spjeldvik, W. N., Expected charge states of energetic ions in the
magnetosphere, Space Sci. Rev., 23, 499, 1979.
-
Spjeldvik, W. N. and Fritz, T. A., Energetic ionized helium in the quiet time
radiation belts: Theory and comparison with observation, J. Geophys.
Res., 83, 654, 1978.
-
Spjeldvik, W. N. and Fritz, T. A., Observations of energetic helium ions in the
Earth's radiation belts during a sequence of geomagnetic storms, J.
Geophys. Res., 86, 2317, 1981.
-
Spjeldvik, W. N. and Fritz, T. A., Experimental determination of
geomagnetically trapped heavy ion fluxes, in Advances in Earth and
Planetary Sciences, edited by R. G. Johnson, vol. 5, Springer Verlag, New
York, 1983.
-
Spjeldvik, W. N. and Rothwell, P. L., The radiation belts, in Handbook of
Geophysics and the Space Environment, edited by A. S. Jursa, chap. 5, pp.
5.1--5.55, Air Force Systems Command, US Air Force, Washington, D.C., 1985.
-
Stern, D. P., Shell splitting due to electric fields, J. Geophys. Res.,
76, 7787, 1971.
-
Tverskoy, B. A., Dynamics of the Earth's Radiation Belt Region, vol.
Technical Translation, TTF-635, NASA, Washington, D.C., 1971.
TOC Comments?
r*bs@rbsp.info
(Due to spamming, delete asterisk)


