
Cusp energetic particle events: Implications
for a major acceleration region of the magnetosphere
Jiasheng Chen,1 Theodore A. Fritz,1
Robert B. Sheldon,1 Harlan E. Spence,1
Walther N. Spjeldvik,1
1 Center for Space Physics, Boston University, Boston,
Massachusetts.
Joseph F. Fennell,2
Stefano Livi, 3 Christopher T. Russell,4
Jolene S. Pickett,5 and Donald A. Gurnett5
2 The Aerospace Corporation, Los Angeles, California.
3 Max-Planck-Institut fuer Aeronomie,
Katlenburg-Lindau, Germany.
4 Institute of Geophysics and Planetary Physics,
University of California, Los Angeles.
5 Department of Physics and Astronomy,
University of Iowa, Iowa City.
The Charge and Mass Magnetospheric Ion Composition Experiment
(CAMMICE) on board the Polar spacecraft observed 75 energetic particle
events in 1996 while the satellite was at apogee. All of these events
were associated with a decrease in the magnitude of the local magnetic
field measured by the Magnetic Field Experiment (MFE) on Polar. These
new events showed several unusual features: (1) They were detected in
the dayside polar cusp near the apogee of Polar with about 79\% of the
total events in the afternoonside and 21\% in the morningside; (2) an
individual event could last for hours; (3) the measured helium ion had
energies up to and many times in excess of 2.4 MeV; (4) the intensity
of 1-200 KeV/e helium was anticorrelated with the magnitude of
the local geomagnetic field but correlated with the turbulent magnetic
energy density; (5) the events were associated with an enhancement of
the low-frequency magnetic noise, the spectrum of which typically
extends from a few hertz to a few hundreds of hertz as measured by the
Plasma Wave Instrument (PWI) on Polar; and (6) a seasonal variation
was found for the occurrence rate of the events with a maximum in
September. These characterized a new phenomenon which we are calling
cusp energetic particle (CEP) events. The observed high charge state
of helium and oxygen ions in the CEP events indicates a solar source
for these particles. Furthermore, the measured 0.52-1.15 MeV helium
flux was proportional to the difference between the maximum and the
minimum magnetic field in the event. A possible explanation is that
the energetic helium ions are energized from lower energy helium by a
local acceleration mechanism associated with the high-altitude dayside
cusp. These observations represent a potential discovery of a major
acceleration region of the magnetosphere.
Introduction
Since the discovery of the Earth's radiation belt by Van Allen and his
colleagues in 1958 [Van Allen and Frank, 1959; Yoshida et
al., 1960; Van Allen, 1963], the studies of the energetic
particles have been extended to include the geomagnetic trapped heavy
ions [Krimigis and Van Allen, 1967; Fritz and Krimigis,
1969] and the trapped isotopic species in the radiation belt [Chen
et al., 1994, 1996a, b; Cummings et al., 1994]. All of
the studies concerning the energetic particles in the radiation belts
are limited to either near the equator or at lower altitude.
On February 24, 1996, Polar was launched into a 1.8 X 9
Re (Earth radius) polar orbit, which has an inclination of 86
deg and a period of 18 hours. Over the first year, the spacecraft
sampled high-altitude regions in the north and low altitudes in the
south and spins with a period of about 6 s. A special feature of the
Polar spacecraft is the onboard interconnection of sensors for
electronic communication that the measured magnetic field can be
communicated to ion sensors for use in data organization. The Charge
and Mass Magnetospheric Ion Composition Experiment (CAMMICE) onboard
Polar consists of two sensors, the Heavy Ion Telescope (HIT) and the
Magnetospheric Ion Composition Sensor (MICS), designed to measure the
charge and mass composition within the geomagnetosphere over the
energy range of 1 KeV/e to 60 MeV/ion, to determine the fluxes
of various ion species and their relative abundances and to seek to
identify mechanisms by which these ions are energized and transported
from their source populations within geospace. The HIT sensor uses a
three-element solid-state detector telescope to measure the rate of
energy loss and the ion's total incident energy, and this permits an
unambiguous determination of the ion's nuclear charge, mass, and
incident energy over the energy range from 100 KeV/ion to 60 MeV/ion.
There are also some discrete discriminators on each detector to create
data response channels that can be accumulated in a manner identical
to a number of previous instruments of this type flown as part of the
science payload of Explorer 45, ATS-6, Viking, and CRRES [Fritz and
Cessna, 1975; Fritz et al., 1985]. The MICS sensor uses
an ogive-shaped electrostatic analyzer, a secondary-electron
generation/detection system, and a solid-state detector to measure the
energy, time-of-flight, and energy per charge of the incident ions,
which permit a unique determination of the ion's incident charge
state, mass, and energy over 1 KeV/e to 400 KeV/e energy
range and provide important information about the origins of the
energetic particles.
The polar orbits of the Polar spacecraft thus provide an excellent
opportunity to investigate the energetic particles in the polar cusp
regions. By definition, the polar cusps are near zero magnetic field
magnitude and funnel-shaped areas between field lines that map to the
dayside and nightside of the magnetopause surface. Theoretically, for
perfect shielding, the cusps are focal points for the shielding
currents confining the magnetosphere [Chapman and Ferraro,
1931]; for not perfect shielding, the cusps become open funnels for
direct entry of magnetosheath plasma into the magnetosphere [e.g.,
Reiff et al., 1977; Reiff, 1979; Marklund et
al., 1990; Crooker et al., 1991; Yamauchi et al.,
1996]. In practice, the cusp regions are identified either by
minimum local magnetic fields [Farrell and Van Allen, 1990] or
by a combination of magnetic field, plasma flow, and plasma wave
[Chen et al., 1997b; Fung et al., 1997]. Depending
upon the interplanetary conditions, the polar cusps can open and close
several times with a period of hours and form local magnetic minima
and maxima to temporarily confine the MeV ions [Chen et al.,
1997a].
On August 27, 1996, Polar/CAMMICE observed an energetic particle event
in the polar cusp region, which showed some unusual features [Chen
et al., 1997a]. Now, we confirm that the event represents a new
magnetospheric phenomenon, and we call it the cusp energetic particle
(CEP) event. A total of 75 CEP events were detected during 1996.
Section 2 describes the August 27, 1996, event as an example of the
CEP events, section 3 lists all of the CEP events measured by CAMMICE
in 1996 and displays their positions in the magnetosphere, section 4
shows the seasonal variations of the CEP events, while section 5
discusses the possible relationships of the energetic helium
intensities with the local magnetic fields. Section 6 discusses the
implications of the results, and section 7 summarizes the discovery of
the CEP events and the discovery of a major acceleration region of the
magnetosphere.
CEP Event: An Example
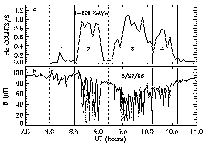
FIGURE 1: An example of the CEP events on August 27, 1996.
(a) The 1-200 KeV/e helium counting rate
versus time, (b) the corresponding
variation of the local geomagnetic field, where the
vertical dashed lines mark the four different regions in the events.
An example of the CEP events is shown in Figure 1. On August 27,
1996, at about 0840 UT when the Polar spacecraft was 9 Re
(Earth's radius) from the Earth at ~ 67o geomagnetic
latitude (MLAT) and ~ 14.7 hours local time (MLT), the MICS
sensor detected a large increase of 1-200 KeV/e helium
intensity (Figure 1a) that was corresponding to a large decrease in
the magnitude of the local geomagnetic field (GMF) measured by the
Magnetic Field Experiment (MFE) [Russell et al., 1995] on
Polar (Figure 1b). In other words, Figure 1 suggests qualitatively
that the 1-200 KeV/e helium intensity was anticorrelated with
the field magnitude. The event lasted more than two hours. A
quantitative relationship between the 1-200 KeV/e helium count
rate and the field magnitude is plotted in Figure 2 with a 3.3-min
average data set during the August 27, 1996, 2-hour event period.
Figure 2 indicates that the helium count rate was most clearly
anticorrelated with the field magnitude when the GMF was in the range
of 50-100 nT.

FIGURE 2: Relationship between the 1-200 KeV/e helium counting rate and
the local field magnitude with a 3.3-min average data set
during the August 27, 1996, 2-hour event period.
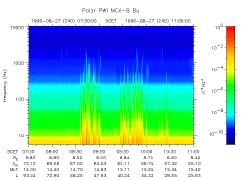
PLATE 1: Frequency-time spectrograms of the plasma wave magnetic field
intensity on August 27, 1996. The intensities are color coded in blue
through red according to the color bar shown to the right.
The distance of Polar from the Earth (in Re), the magnetic latitude, the
magnetic local time (MLT), and the L shell values are shown at the bottom.
Broadbanded magnetic field turbulence is seen
during the four period of interest shown in Figure 1.
Plate 1 presents measurements by the Plasma Wave Investigation (PWI)
[Gurnett et al., 1995] on Polar of the plasma wave intensities
on August 27, 1996, for the same time period as shown in Figure 1.
The data are displayed as a frequency-time spectrogram with magnetic
power density increasing as colors go from blue to yellow and red.
The distance of Polar from the Earth (in Re), the magnetic
latitude, the magnetic local time (MLT), and the L shell values are
shown at the bottom of the plate. The important point to be made from
Plate 1 is that there are broad bandwidth bursts of magnetic noise
extending from below 5.6 Hz up to about 1 kHz which appear to
correlate well with the magnetic field decreases and helium count rate
increases observed in Figure 1. The low-frequency noise is believed
to arise from the turbulent magnetic fields in a plasma and must
consist of whistler mode waves, because no other electromagnetic modes
of propagation occur in the frequency range in which the turbulence is
observed, i.e., between the proton cyclotron frequency and the
electron cyclotron frequency. In Plate 1, one feature of the spectrum
during the CEP event is the rapid decrease in intensity with
increasing frequency; the other feature to note is that the most
intense emissions occur at frequencies less than about 200 Hz.
Furthermore, a closer examination of Figure 1 indicates that there
were four helium peaks that were associated with four local minima in
the field magnitude and corresponded to four different regions:
8.0-8.5 UT, 8.5-9.2 UT, 9.2-10.1 UT and 10.-10.6 UT, and they were
designated as four individual CEP events. The numbers of 1, 2, 3, and
4 within the vertical dashed lines in Figure 1a mark the four
different regions in this period. The four-peak feature at high
latitude was also found both in the 20-200 KeV electron fluxes (
Figure 3a) measured by the Imaging Electron Sensor (IES) and in the
20-500 KeV proton fluxes (Figure 3b) by the Imaging Proton Sensor
(IPS). The IES and IPS are two sensors in the CEPPAD (Comprehensive
Energetic Particle and Pitch Angle Distribution) experiment on Polar
spacecraft [Blake et al., 1995]. It is significant to note
that the energetic electron intensities are also enhanced by the same
process responsible for producing the CEP events.
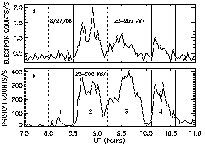
FIGURE 3: Counting rates versus time for both the (a) 20-200 KeV
electrons and (b) 20-500 KeV protons during the
same time periods as in Figure 1, where the
vertical dashed lines mark the four different regions in the events.
The most remarkable feature is that there is an increase of the
0.52-1.15 MeV helium flux of more than 2 orders of magnitude detected
by the HIT sensor within the event period [Chen et al.,
1997a]. This is indeed very surprising because it is unexpected
theoretically [e.g., Ilyin et al., 1986; Chen et al.,
1996b]. The aforementioned features for the events on August 27,
1996, are also present in other events during different days.
Total CEP Events and Their Positions in Magnetosphere
TABLE 1: CEP Events in 1996
| Date |
Universal Time |
Number |
LFN |
| |
hours |
of Events |
enhanced |
| May 29 | 3.80-7.10 | 3 | Y |
| June 20 | 4.80-7.10 | 2 | Y |
| July 21 | 0.70-2.00 | 2 | Y |
| July 26 | 2.80-5.00 | 3 | Y |
| July 31 | 7.50-9.80 | 2 | Y |
| Aug. 14 | 3.50-8.00 | 2 | Y |
| Aug. 16 | 8.00-10.6 | 3 | Y |
| Aug. 22 | 23.5-24.0 | 1 | Y |
| Aug. 23 | 0.00-3.60 | 3 | Y |
| Aug. 24 | 10.4-13.6 | 2 | Y |
| Aug. 27 | 8.00-10.6 | 4 | Y |
| Aug. 28 | 2.40-4.00 | 2 | Y |
| Aug. 28 | 21.4-23.0 | 3 | Y |
| Aug. 30 | 7.00-8.70 | 1 | N |
| Sept. 8 | 2.00-4.50 | 3 | Y |
| Sept. 10 | 4.50-8.90 | 2 | Y |
| Sept. 11 | 0.80-3.60 | 2 | Y |
| Sept. 11 | 19.5-22.4 | 2 | Y |
| Sept. 14 | 0.30-1.50 | 2 | Y |
| Sept. 18 | 7.20-10.1 | 3 | Y |
| Sept. 19 | 20.8-22.5 | 2 | Y |
| Sept. 20 | 13.8-16.3 | 3 | Y |
| Sept. 21 | 5.70-8.80 | 1 | Y |
| Sept. 22 | 0.70-3.00 | 3 | Y |
| Sept. 27 | 2.00-6.20 | 2 | Y |
| Sept. 27 | 22.0-23.5 | 1 | Y |
| Sept. 29 | 7.50-9.50 | 1 | Y |
| Oct. 2 | 4.20-6.70 | 3 | Y |
| Oct. 8 | 2.40-4.00 | 2 | Y |
| Oct. 8 | 21.0-23.0 | 1 | Y |
| Oct. 9 | 15.6-17.0 | 1 | Y |
| Oct. 13 | 5.40-8.40 | 2 | Y |
| Oct. 13 | 23.0-24.0 | 1 | Y |
| Oct. 14 | 0.00-1.30 | 2 | Y |
| Nov. 4 | 5.60-8.80 | 3 | Y |
Here LFN is low-frequency noise; N, no; Y, yes.
Table 1 tabulates the 75 CEP events detected by Polar during 1996.
The cusp regions, where the CEP events were detected, were identified
from MICS plasma flow, MFE magnetic field, and PWI plasma wave by
criteria similar to that used by Chen et al. [1997b] and
Fung et al. [1997]. It is not uncommon to observed multievents
in a given day, which indicates how dynamic the polar cusp is. Table
1 also shows that all but one of the CEP events were associated with
the low-frequency noise enhancements.
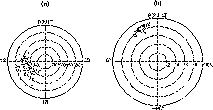
FIGURE 4: The event-averaged positions of the CEP events in the
magnetosphere with (a) MLT versus MLAT and (b) MLAT versus R
in polar coordinates. In Figure 4a, the four dashed circles from
inside to outside indicate the MLAT positions from 80o to 50o,
respectively; while in Figure 4b, the dashed circles represent the distance
of Polar from the Earth (in Re, Earth's radius).
Figure 4 exhibits the event-averaged positions of the CEP events in
the magnetosphere with plots of MLT versus MLAT (Figure 4a) and MLAT
versus R/Re (Figure 4b) in polar coordinates. In Figure 4a, the
four dashed circles from inside to outside indicate the MLAT positions
from 80o to 50o, respectively. In Figure 4b, the dashed
circles represent the distance of Polar from the Earth (in Re,
Earth's radius). Figure 4a reveals that the CEP events were observed
in the dayside and that the event distribution is asymmetric about
noon. In the regions of R>7 Re, 7 hours<MLT<17
hours, and 45o<MLAT<80o, the sample-time of the
morningside by the Polar was about 0.87 of that of the afternoonside
in 1996, so that after normalized by the sample-time one obtained
nearly 79\% of the total events in the afternoonside and 21\% in the
morningside. This result is different from that of the lower energy
plasma that enters into ionosphere through the low-altitude cusp where
a more symmetric distrubition is expected and found [e.g., Heikkila
and Winningham, 1971; Frank, 1971; Marklund et
al., 1990]. Both panels in Figure 4 also reveal that the CEP
events spanned more than 20 deg in geomagnetic latitude, which is also
different from the expectation of the low-altitude cusp where it is
observed to be only about 4 deg or less in latitude [e.g., Menietti
and Burch, 1988; Marklund et al., 1990; Yamauchi et
al., 1996], but is consistent with the high-altitude cusp's
result [Fung et al., 1997] where cusp widths of about 30 deg
were reported.
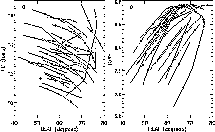
FIGURE 5: The same events as in Figure 4 with the start and the end points
of each event being joined by a single line in Cartesian coordinates.
Figure 5 displays the same events as Figure 4 by joining the start and
end points of each event with a single line in Cartesian coordinates.
Figure 5a shows that the position of these CEP events could occur over
6 hours in local time and 30 deg in latitude, much larger than
expected, and that the observed CEP events peaked around
60o-70o MLAT. Another interesting feature is that the CEP
events extended more degrees in latitude in the afternoonside than
that in the morningside. For an individual CEP event at 8.5
Re, it had a typical value of about 10 deg in latitude (see
right panel). All CEP events were observed at radial distances greater
than 7 Re. Figure 5 gives the size of polar cusp
regions.
Seasonal Variations and Energy Spectrum of CEP Events
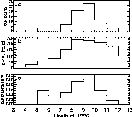
FIGURE 6: The monthly (a) CEP events, (b) the time (C-time) spent by
Polar in the region where the CEP events may be detected, and (c)
the occurrence rates of the CEP events (normalized by the C-time) during 1996.
The CEP events also exhibit seasonal variations. Figure 6a is a
histogram showing the distribution of the monthly CEP events during
1996. A peak value of 27 events was measured in September. Before
ascribing this to a seasonal variation, one needs to examine the
Polar's orbit effect. As mentioned in the last section, those Polar
orbits with R>7 Re, 7 hours<MLT<17 hours, and
45o<MLAT<80o are chosen as the region where a CEP
event may be detected, and the time (C-time) spent by the Polar
spacecraft in such a region is shown in Figure 6b. If Polar spends
less time in such a region, one would expect to observe fewer events.
This is the case before May 1996, which may explain why no CEP events
were observed during March and April. However, this is not the case
after May 1996. The C-time in Figure 6 indicates that there were
ample opportunities for POLAR to pass through the dayside cusp region
during June to December periods. Therefore the variation of the CEP
event occurrence rate during June to December 1996 was real seasonal
effect, as showed in the bottom panel of Figure 6, where the CEP
events are normalized by the C-time. A similar seasonal dependence
was found by Newell and Meng [1988, 1989] in low-altitude study
of cusp ion precipitation.
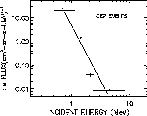
FIGURE 7: Helium energy spectrum of the CEP events in 1996.
The energy spectrum, presented in Figure 7, shows the helium flux
averaged over all of the CEP events when energetic helium data are
available. The four HIT energy passbands from top to bottom in Figure
7 are 0.52-1.15 MeV, 1.15-1.8 MeV, 1.8-2.4 MeV, and 2.4-8.2 MeV,
respectively. Figure 7 suggests a power law spectrum, and the least
squares fit (solid line in Figure 7) gives a spectral index of
4.6+/-0.9. The important point is that the helium energy in the CEP
events can be greater than 2.4 MeV. During aforementioned CEP event
times, the Dst index showed rather geomagnetically ``quiet''
periods. No comparable flux was observed by the Wind spacecraft for
all of the CEP event periods. This suggests a local acceleration
region.
Relationships of He Intensity With Local GMF
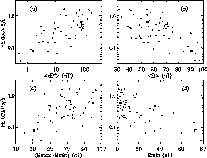
FIGURE 8: Event-averaged counting rate of the 1-200 KeV/e
helium versus four
different local GMF parameters in four panels: (a) <dB2>,
(b) <B>,
(c) Bmax - Bmin, and (d) Bmin, where < <>
represents event
average, dB = B_i+1 - B_i, and Bmax and Bmin are
maximum and minimum field magnitudes during an individual event period,
respectively. The four open squares represent the four events on
August 27, 1996.
The local magnetic fields play an important role in organizing the
measured energetic helium intensities. Figure 8 associates the
event-averaged counting rate of the 1-200 KeV/e helium with
four different local GMF parameters in four panels:
<dB2> (Figure 8a), <B> (Figure 8b),
Bmax - Bmin (Figure 8c), and Bmin
(Figure 8d), where < > represents event average,
dB = B_i+1 - B_i from 6 s resolution field data, and Bmax
and Bmin are
maximum and minimum field magnitudes during an individual event
period, respectively. The four open squares are the four events on
August 27, 1996. The event-averaged method was used to reduce the
irregular and random fluctuations and to analyze the statistical
properties. (Note that because of data gaps, no valid 1-200
KeV/e helium data for the third event period on September 18,
1996, and the event period on September 19, 1996, are available, and
no valid GMF data after September 30, 1996, are accessible at this
time.) Figure 8 reveals that the 1-200 KeV/e helium
intensities were best organized by <dB2> (Figure 8a), and that
there was an anticorrelation between 1-200 KeV/e helium
intensities and the event-averaged (mean) field (Figure 8b). Figure
8d also shows an anticorrelation of 1-200 KeV/e helium
intensities with the Bmin and indicates that most CEP events are
concentrated at Bmin < 10 nT. In Figure 8c, a poor correlation
of 1-200 KeV/e helium counting rates with Bmax - Bmin
is found when this difference is less than 50 nT; however, when the
field difference is greater than 50 nT, no correlation is found (see
also the squares in Figure 8c).
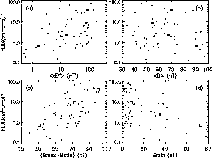
FIGURE 9: The similar plot as in Figure 8 but for 0.52-1.15 MeV helium ions.
Figure 9 is a plot similar to Figure 8 but for 0.52-1.15 MeV helium
ions; in Figure 9c it exhibits a clear linear correlation between the
0.52-1.15 MeV helium flux and the field difference for all events
(dots) and for the August 27, 1996, events (squares). Comparing with
Figure 8, Figure 9 shows less correlation between the 0.52-1.15 MeV
helium intensities and the <dB2> in Figure 9a, no correlation of
the helium flux with the mean field in Figure 9b, but clearly
anticorrelation with Bmin in Figure 9d.
Discussion
It is well known that the dayside magnetosheath is dominated by solar
wind plasma with high ion charge states and solar composition
[Gloeckler et al., 1986]. Chen et al. [1997a] reported
that the August 27, 1996, events exhibit large amounts of He++
and O+++.... Our analysis of all of the CEP events listed in
Table 1 has determined that (1) the 1-200 KeV/e helium ions are
He++; i.e., compared to He++,
the He+ is negligible; (2)
compared to O+++..., the O+,++ is negligible; and (3) at 1-200
KeV/e, the helium particles are the dominant heavy ions with an
intensity of about 1 order of magnitude larger than the oxygen ions.
These facts suggest a solar source for the particle fluxes in the CEP
events.
It is generally held that there are two energy storage regions in the
magnetosphere with one in the geomagnetic tail and the other one in
the ring current. However, these Polar observations seem to suggest a
third energy storage region. The pitch angle distributions of
0.52-1.15 MeV helium in the August 27, 1996, CEP events were found to
be different from an isotropic distribution, and the helium ions
showed different energy spectra in different CEP events [Chen et
al., 1997a]. This is also a characteristic of other CEP events
listed in Table 1 as well. The point here is that the observed helium
ions in the CEP events are from the same solar source but that they
exhibit different energy spectra in different cusp regions. Therefore
the measurements suggest that the CEP events constitute a new
temporarily confined heavy ion population that was controlled by some
local accelerating and confining mechanism [Chen et al.,
1997a]. These results imply an unanticipated energy storage and
transfer region associated with the polar cusps. The CEP events may
also be related to the large (more than 2 orders of magnitude)
increase of the MeV helium flux in the outer radiation belt as
observed for the CEP events on August 27, 1996, reported by Chen et
al. [1997a].
Axford [1970] has suggested that ions can be directly injected
into the polar regions from the magnetosheath and subsequently
accelerated, and Bird [1975] discussed a mechanism for the
capture of solar wind ions and their subsequent trapping. While it is
clear that the high charge state ions originated from the
magnetosheath, the injection and trapping mechanisms for these ions
remain unknown. The extremely low frequency electromagnetic waves
that are observed during the CEP events are similar to the lion roars
observed in the magnetosheath on ISEE and discussed by Tsurutani et
al. [1982]. Their study concluded that the lion roars that were
detected close to the magnetopause were generated by the cyclotron
instability of anisotropic thermal electrons when the local plasma
critical energy falls to values close to or below the electron thermal
energy, 25 eV, as a result of decreases in B, or conversely, in
high-beta (10-25) regions. The lion roars are terminated by increases
in the ambient magnetic field. In the present study, the magnetic
field turbulence, in association with the decreases in magnetic field
and increases in helium counts, may be an indication of plasma
injection from the magnetosheath through sporadic reconnection.
Figure 8d demonstrated that most CEP events are concentrated at
Bmin < 10 nT, which suggests that a strong diamagnetic cavity
can be produced at high latitude in the northern polar cusp. The
anticorrelation between 1-200 KeV/e helium intensities and the
event-averaged (mean) field in Figure 8b is also consistent with the
existence of a diamagnetic cavity.
The conversion of magnetic energy to plasma energy through
reconnection and acceleration by induction electric fields has been
suggested for some time as a means to accelerate particles. There
have been no in situ observations to provide the detail information
for investigating such energy conversion and acceleration mechanisms
at the high altitude polar cap until the launch of the
well-instrumented Polar spacecraft. In Figure 8, since the <dB2>
term is proportional to the turbulent magnetic field energy density,
the correlation between 1-200 KeV/e helium counting rates and
the <dB2> in Figure 8a may be interpreted to mean that the
turbulent magnetic energy density is converted into the helium ion's
kinetic energy. This seems to point to a resonant or an induction
electric field acceleration mechanism for the 1-200 KeV/e
helium ions. Furthermore, the fact that the MeV helium ions in the
CEP events are controlled by the field difference (Bmax - Bmin)
(Figure 9c) suggests that the acceleration mechanism for MeV
helium is either different from that for 1-200 KeV/e helium or
greater than that by which the former are energized. These
observations represent a potential discovery of a major acceleration
region of the magnetosphere.
Summary and Conclusions
The Charge and Mass Magnetospheric Ion Composition Experiment (CAMMICE)
on board Polar spacecraft observed 75 CEP
events in the polar cusp regions in 1996. All of these events
were associated with a decrease in the magnitude of the local magnetic
field measured by the Magnetic Field Experiment (MFE) on Polar.
Our principal conclusions are the following:
-
They were detected in the dayside polar cusp near the apogee of Polar with
about 79\% of the total events ocurring in the afternoonside and 21\% in the
morningside.
-
An individual event could last for hours, and the measured helium ion
had energies up to and many times in excess of 2.4 MeV.
-
The intensity of 1-200 KeV/e helium was anticorrelated with the
magnitude of the local geomagnetic field but correlated with the
turbulent magnetic energy density.
-
All but one of the events were associated with magnetic field turbulence
in the frequency range between
the proton cyclotron frequency and electron cyclotron frequency.
-
A seasonal variation was found for the occurrence
rate of the events with a maximum in September.
The observed high charge state of helium and oxygen
ions in the CEP events indicates a solar source for these particles.
-
At energy range of 0.52-8.2 MeV, the helium energy spectrum in the
CEP events can be represented by a power law with an index of 4.6+/-0.9.
-
The measured 0.52-1.15 MeV helium flux was proportional to the
difference between the maximum and the minimum magnetic field in the event.
-
A possible explanation is that the energetic helium ions are
energized from lower energy helium by a local acceleration mechanism
associated with the high-altitude dayside cusp. These observations
represent a potential discovery of a major acceleration region of
the magnetosphere.
ACKNOWLEDGMENTS
We want to acknowledge the contribution of B. Laubscher, R. Hedges,
R. Vigil, and G. Lujan on the CAMMICE HIT sensor system at the
Los Alamos National Laboratory; R. Koga, P. Lew, N. Katz,
and B. Crain on the HIT data processing unit at the Aerospace Corporation;
and the admistrative support and interest provided by D. D. Cobb at
the Los Alamos National Laboratory. We thank J. D. Sullivan
and S.-Y. Hsieh for useful discussions.
This research was supported by NASA grant NAG5-2578.
The POLAR PWI research was supported by NASA contract NAS5-30371.
The Editor thanks T. J. Rosenberg and A. D. Johnstone for their
assistance in evaluating this paper.
References
-
Axford, W. I., On the origin of radiation belt and auroral primary
ions, in Particles and Fields in the Magnetosphere,
edited by B. M. McCormac, p. 46, D. Reidel, Norwell, Mass., 1970.
-
Bird, M. K., Solar wind access to the plasma sheet along the flanks of
the magnetotail, Planet. Space Sci., 23, 27, 1975.
-
Blake, J. B., et al., CEPPAD experiment on POLAR,
Space Sci. Rev., 71, 531, 1995.
-
Chapman, S., and V. C. A. Ferraro, A new theory of magnetic storms,
J. Geophys. Res., 36, 171, 1931.
-
Chen, J., T. G. Guzik, Y. Sang, J. P. Wefel, and J. F. Cooper,
Energetic helium particles trapped in the magnetosphere,
Geophys. Res. Lett., 21, 1583, 1994.
-
Chen, J., T. G. Guzik, J. P. Wefel, K. R. Pyle, and J. F. Cooper,
Geomagnetically trapped energetic helium nuclei,
in Workshop on the Earth's Trapped Particle Environment (Taos),
Conf. Proc. 383, edited by G. D. Reeves, pp. 161-167,
AIP Press, Woodbury, N. Y., 1996a.
-
Chen, J., T. G. Guzik, J. P. Wefel, K. R. Pyle, and J. F. Cooper,
Energetic helium isotopes trapped in the magnetosphere,
J. Geophys. Res., 101, 24787, 1996b.
-
Chen, J., T. A. Fritz, R. B. Sheldon, H. E. Spence, W. N. Spjeldvik,
J. F. Fennell, and S. Livi, A new temporarily confined population in the
polar cap during the August 27, 1996 geomagnetic field distortion period,
Geophys. Res. Lett., 24, 1447, 1997a.
-
Chen, S.-H., S. A. Boardsen, S. F. Fung, J. L. Green, R. L. Kessel,
L. C. Tan, T. E. Eastman, and J. D. Craven,
Exterior and interio polar cusps: Observations from Hawkeye,
J. Geophys. Res., 102, 11335, 1997b.
-
Crooker, N. U., F. R. Toffoletto, and M. S. Gussenhoven, Opening the cusp,
J. Geophys. Res., 96, 3497, 1991.
-
Cummings, J. R., A. C. Cummings, R. A. Mewaldt, R. S. selesnick, E. C. Stone,
and T. T. von Rosenvinge, MAST observations of high energy trapped helium
nuclei (abstract), Eos Trans. AGU, 75, Spring Meet. Suppl., 301, 1994.
-
Farrell, W. M., and J. A. Van Allen, Observations of the Earth's polar
cleft at large radial distances with the Hawkeye 1 magnetometer,
J. Geophys. Res., 95, 20945, 1990.
-
Frank, L. A., Plasma in Earth's polar magnetosphere,
J. Geophys. Res., 76, 5202, 1971.
-
Fritz, T. A., and J. R. Cessna, ATS-6 NOAA low energy proton experiment,
IEEE Trans. Aerospace Electron. Sys., AES-11, (6), 1145, 1975.
-
Fritz, T. A., and S. M. Krimigis, Initial observations of geomagnetically
trapped protons and alpha particles with OGO 4,
J. Geophys. Res., 74, 5132, 1969.
-
Fritz, T. A., et al., The mass composition instruments (AFGL-701-11),
in CRRES/SPACERAD Experiment Descriptions, Rep. AFGL-TR-85-0017,
edited by M. S. Gussenhoven, E. G. Mullen, and R. C. Sagalyn, p. 127,
Air Force Geophy. Lab., Hanscom Air Force Base, Mass., 1985.
-
Fung, S. F., T. E. Eastman, S. A. Boardsen, and S.-H. Chen,
High-altitude cusp positions sampled by the Hawkeye satellite,
Phys. Chem. Earth, in press, 1997.
-
Gloeckler, G., et al., Solar wind carbon, nitrogen and oxygen abundances
measured in the Earth's magnetosheath with AMPTE/CCE,
Geophys. Res. Lett., 13, 793, 1986.
-
Gurnett, D. A., et al., The polar plasma wave instrument,
Space Sci. Rev., 71, 597, 1995.
-
Heikkila, W. J., and J. D. Winningham, Penetration of magnetosheah
plasma to low altitudes through the dayside magnetospheric cusps,
J. Geophys. Res., 76, 883, 1971.
-
Ilyin, V. D., I. V. Ilyin, and S. N. Kuznetsov, Stochastic instability of
charged particles in a geomagnetic trap, Cosmic Res. 24, 75, 1986.
-
Krimigis, S. M., and J. A. Van Allen, Geomagnetically trapped alpha particles,
J. Geophys. Res., 72, 5779, 1967.
-
Marklund, G. T., L. G. Blomberg, C.-G. Falthammar, R. E. Erlandson,
and T. A. Potemra, Signatures of the high-altitude polar cusp and dayside
auroral regions as seen by the Viking electric field experiment,
J. Geophys. Res., 95, 5767, 1990.
-
Menietti, J. D., and J. L. Burch, Spatial extent of the plasma injection region
in the cusp-magnetosheath interface, J. Geophys. Res., 93, 105, 1988.
-
Newell, P. T., and C. I. Meng, Hemispherical asymmetry in cusp
precipitation near solstices, J. Geophys. Res., 93, 2643, 1988.
-
Newell, P. T., and C. I. Meng, Dipole tilt angle effects on
the latitude boundary layer, J. Geophys. Res., 94, 6949, 1989.
-
Reiff, P.H., Low-altitude signatures of the boundary layers,
in Magnetospheric Boundary Layers, Eur. Space Agency Spec. Publ.,
ESA SP-148, 167-173, 1979.
-
Reiff, P. H., T. W. Hill, and J. L. Burch, Solar wind plasma
injection at the dayside magnetospheric cusp,
J. Geophys. Res., 82, 479, 1977.
-
Russell, C. T., R. C. Snare, J. D. Means, D. Pierce, D. Dearborn, M. Larson, G.
Barr and G. Le, The GGS/POLAR magnetic fields investigation,
Space Sci. Rev., 71, 563, 1995.
-
Tsurutani, B. T., E. J. Smith, R. R. Anderson, K. W. Ogilvie, J. D. Scudder,
D. N. Baker, and S. J. Bame, Lion roars and nonoscillatory drift mirror
waves in the magnetosheath,
J. Geophys. Res., 87, 6060, 1982.
-
Van Allen, J. A., Dynamics composition and origin of the geomagnetically
trapped corpuscular radiation, in
Space Science, pp. 266-274, John Wiley, New York, 1963.
-
Van Allen, J. A., and L. A. Frank, Radiation around the Earth to a radial
distance of 107,400 km,
Nature, 183, 430, 1959.
-
Yamauchi, M., H. Nilsson, L. Eliasson, O. Norberg, M. Boehm, J. H. Clemmons,
R. P. Lepping, L. Blomberg, S.-I. Ohtani, T. Yamamoto, T. Mukai, T. Terasawa,
and S. Kokubun, Dynamic response of the cusp morphology to the solar wind:
A case study during passage of the solar wind plasma cloud on February 21, 1994,
J. Geophys. Res., 101, 24675, 1996.
-
Yoshida, S., G. H. Ludwig, and J. A. Van Allen, Distribution of trapped
radiation in the geomagnetic field,
J. Geophys. Res., 65, 807, 1960.
TOC Comments?
r*bs@rbsp.info
(due to spamming, delete the asterisk)


