Comment on "Origins of energetic ions in the cusp" by Trattner et al.
Robert Sheldon1, Jiasheng Chen and T. A. Fritz2
1Wheaton College, Wheaton, IL 601872Boston University, Boston, MA 02215
Journal of Geophysical Research, 108,(A7), 1302, doi:10.1029/2002JA009575, 2003
Abstract
The paper by Trattner et al.,[2001] henceforth TETAL,
reanalyzes the data of Chen et al. [1998] (CFS) and attempts
to prove two statements: first, that the energetic ions observed
in the cusp by CFS were actually accelerated at the bow shock and
then transported to the cusp; and second, that the detected ions
are not accelerated locally. Quoting TETAL's abstract, ``An
alternative explanation for the energetic particle events is that
they are accelerated at the quasi-parallel bowshock, then
transported downstream and enter the cusp along newly reconnected
field lines or some other solar wind entry mechanism....No local
acceleration is required to explain the observed CEP events up to
150 keV/e.'' We object that neither assertion of TETAL is
defensible on theoretical or experimental grounds. Indeed we find
the conclusions of the paper are flawed by both statistical and
logical errors. In section 1, we outline the logical flaws, in
section 2 the misuse of the scientific method, in section 3 the
improper use of statistics, and in section 4, the mishandling of
spacecraft data. Finally, in section 5 we apply the scientific
method of hypothesis testing to the two theories, arguing that
given complete ignorance of the data, the hypotheses of CFS are
preferable to TETAL.
1. Logic
The first problem we encounter in TETAL is a matter of logic. In
order to prove the existence of a new space physics phenomenon,
one example is sufficient, though of course, with the vagaries of
experimental science, several examples demonstrating consistency
are even better. In order to disprove the existence of a purported
phenomenon empirically, however, every example must be reanalyzed
for some deficiency that disqualifies said phenomenon for
existence. Now CFS argue for the existence of a new local
acceleration phenomenon they named cusp energetic particle events,
or CEP, characterized by a high density of locally accelerated
energetic (E > 30 keV) ions in a diamagnetic cavity in the
vicinity of the high latitude cusp for which they presented 75
instances. TETAL argue that 53/75 of CFS events are bow shock
accelerated and therefore not locally accelerated. Even supposing
TETAL were correct, such limited reanalysis cannot disprove the
CFS hypothesis, because they have not reanalyzed all the events.
More significant for TETAL's reanalysis is the justification they
give for excluding 22/75 events. They implicitly argue that CFS
mistakenly included them in CEP events. In their Reply they
explicitly state that the cusp is identified with reconnected
field lines possessing low-energy (E<10 keV) magnetosheath
plasma which is missing in the 22/75 events. This explanation of
the filtering shows both experimental and theoretical
misconceptions.
First, since the CEP identification is indifferent to a
low-energy, E < 10 keV, component (remember the definition was
for energetic ions), such a filtering criterion is completely
inappropriate. The phenomena is defined experimentally, not
semantically, no matter what title CFS christen it with.
Second, the cusp has been defined in a number of non-identical
ways in the literature, including a spatial location given by
latitude and longitude, an ionospheric precipitation signature, a
topological region defined by gradients in the B-field, as well as
TETAL's method of the existence of a low energy sheath component.
Clearly CFS and TETAL disagree on the proper definition of the
cusp, which should at least flag the TETAL filter as an
inappropriate and subjective selection criterion.
Third, there is deep significance in the difficulty in defining
the cusp with particle signatures. Low energy particles, such as
magnetospheric sheath particles, (E < 10keV), are viewed as
``glued'' to the field line due to their dominant E X B-drift,
and thus become ideal tracers of the reconnection
history of a particular field line, which is one definition of the
cusp. In contrast, energetic particles (E > 30keV) are dominated
by ∇ B-drift and thus become ideal tracers of the
global gradient/curvature topology of the field. As Sheldon et al.
[1998] describe, the cusp field line that passes through the
minimum B-field at the magnetopause forms the center of a
quadrupole trap that provides permanent confinement of energetic
particles. Ever since the earliest B-field models for the Earth
were discussed, the vicinity of this quadrupole minima field line
can and has been referred to as the cusp. These two definitions of
``cusp'' overlap just as the plasmasphere and the ring current
regions of the dipole trap overlap, and are complementary views of
the same region of space. The diamagnetic cavities observed by CFS
would not be in static equilibrium and would therefore not survive
as trapping regions unless they occurred at the quadrupole minimum
(Sheldon [2002]). It is this quadrupole topology that CFS refer to
as ``cusp'', and is entirely appropriate terminology for all 75 CEP
events described. Thus, applying a low energy criteria to a high
energy phenomena is a misunderstanding of the appropriate
energy-dependent physics.
Finally, the consequence of applying any filter to a data set,
whether justified or not, is a well known bias introduced into the
analysis, which in the world of statistical analyses, is known as
``cherry picking''. Since many data analysts assume that the use
of data filters is subjective anyway, they condone this practice
implicitly, if not explicitly, but as we endeavor to show next, it
has strongly biassed the TETAL reanalysis.
2. Scientific Method
The scientific method is an approach to analyzing data that
attempts to evaluate competing hypotheses by comparing them to
unbiased data. This can be cast in terms of Bayesian statistics
[ Silva, 1996], which we omit for the sake of brevity, but
which argues that a division or filtering of a data set is
unbiassed only if it is uncorrelated with the result, say, by
selecting every 3rd event. However TETAL's filtering removed those
events which had no low energy component, and then maxwellian fits
to the low energy component were subsequently used to argue for a
bow-shock source. That is, by choosing only those CEP events that
look like bow shock acceleration, and rejecting those that ``will
have a strong influence on several of the key parameters in this
investigation'', it is not so surprising that TETAL found that
their subset of CEP events are similar to bow shock ions.
Regardless of how impressive the statistics of the remainder of
the paper, the first conclusion is suspect because it has been
introduced in the assumptions.
A second mistake in hypothesis testing made by TETAL concerns the
evaluation of the multiparameter models on a given data set.
This is commonly known as Occam's razor, which is interpreted to
mean that the fewer the number of adjustable parameters required,
the better. Again, Bayesian statistics can quantify this
qualitative discussion which is a neglected point in data
analysis.
Let there be two hypotheses, A and B, with B having one additional
adjustable parameter k, which is constrained by prior knowledge to
lie between kMIN and kMAX. With some rather weak
restrictions we can then write the ratio ( Silva [1996]):
     prob(A|D,I)   prob(A|I)   prob(D|A,I)      k_max - k_min
     ----------  = -------- x -------------  x --------------
     prob(B|D,I)   prob(B|I)   prob(D|k,B,I)     dk √(2π)
If the ratio is greater than 1, then hypothesis A is better, otherwise
B wins. Quoting extensively from Silva [1996]:
``The first term on the right-hand side reflects our relative prior
preference for the alternative theories; to be fair, we can take it
to be unity. The second term is a measure of how well the best
predictions from each of the models agree with the data; with the
added flexibility of his adjustable parameter, this maximum likelihood
ratio can only favour B. The goodness-of-fit, however, cannot be the
only thing that matters; if it was, we would always prefer more
complicated explanations. Probability theory tells us that there is,
indeed, another term to be considered. ...As such, the final term...
acts to penalise B for the additional parameter; for this reason,
it is often called an Ockham factor.''
Now if we look at figure 2 or figure 3 of TETAL, we see that they
have used four 3-parameter maxwellians (or as described in their
Reply, a 2-parameter linear fit in log(f) space with a 1-parameter
Energy breakpoint constraint), or 12 adjustable parameters to fit
their spectra. In contrast, CFS argue for a 2 parameter power-law
fit, which if we include the data rollover at low energy (not
strictly necessary for CEP event characterization) becomes a 4
parameter kappa-function (or Mittag-Leffler function) fit. The
extra 8 parameters in TETAL introduce 8 Ockham factors, which,
unless highly constrained theoretically, would greatly favor the
CFS hypothesis.
This is a significant point, and worth restating. If TETAL's extra
8 parameters were forced by theory to lie in a very narrow range,
then they are no longer completely free parameters and will have
little penalty in hypothesis evaluation. However, we find just the
opposite, that not theory, but practice constrains the extra
parameters of the fit, suggesting that the penalty terms are very
large. That is, no matter how elegantly TETAL fit their data
with a 12-parameter function, a simpler 4-parameter function with
similar residuals must be preferred from a Baysean
viewpoint.
TETAL argue in their reply that they use a minimum regression
analysis of two free parameters to do a piecewise continuous fit
to their data in 4 segments giving 8 adjustable parameters. This
is erroneous. If the breakpoints were not specified beforehand,
TETAL's 8-parameter regression fit would likely not converge to
their published value. There remain 12 fit parameters, only TETAL
have used a human intelligence to fix four of them. This is
significant, for without proper treatment of human bias, (where to
place the break points) the statistics can become grossly
distorted by inappropriate limits.
Naturally, TETAL give reasons why they think a 12-parameter
function is to be preferred, (it worked well in a previous paper
analyzing bow shocks) and where to place the break points, but all
such ad hoc reasoning reintroduces the conclusions back into
the analysis. Thus both in segregating the data, and in fitting
the data, TETAL show a propensity for allowing their conclusions
to dictate their analysis. The grave danger here, and all data
analysts should beware this trap, is that we attribute more
importance to a self-referential analysis than it deserves in
a Baysean sense.
In addition to errors of logic and scientific method,
many of the statistics used by TETAL do not reflect a thorough
understanding of error propagation and model testing, which may
also invalidate their conclusions as we discuss next.
3. Statistical Analyses
Fitting Errors:
In TETAL's Figure 2, a CEP event is fit with 4 maxwellian
distributions, 12 free parameters, or 8 fitted parameters. No
table of fitted parameters, confidence limits on the parameters or
correlation coefficients is presented. Cursory examination of the
plot shows that only the first maxwellian is constrained in
magnitude (density), break-point position and width (temperature).
Clearly the next 3 maxwellians have coupled (large cross terms in
the covariance matrix) magnitude, break-point position and widths.
TETAL's analysis technique, serially performing linear regression
analysis to the segmented data, excludes the possibility of
measuring the cross terms that appear to be so large. This is
significant, because the technique of reducing a maxwellian to a
linear function by taking the logarithm obviously cannot be
performed on the sum of 4 maxwellians, since the logarithm of a
sum is not so easily reduced. But note that this linearization
technique, popular before the advent of computer fitting,
cannot tolerate an additive background term which invariably
exists from the adjacent maxwellians, as TETAL admit in their
Reply. Thus by default, TETAL cannot find the cross correlation
terms, and must completely trust their proper identification
of energy-breakpoints.
If TETAL had done all 12 parameters at once, using a non-linear
maximum likelihood technique appropriate to the problem, a smaller
chisquared would probably be obtained with only 3 maxwellians just
due to the three-fewer parameters. Which is to say, the use of 4
fitting maxwellians must involve fixing either the break-point
position or the amplitude of the 3 energetic peaks, or otherwise
the maximum likelihood method would drive them to ridiculous
values. As TETAL make clear in their reply, at least 3 parameters
(the breakpoints) of the 12 parameter fit are assumptions, and not
fits at all.
Thus no error bars are plotted on the data because a maximum
likelihood method to the full problem has not been employed in the
first place, and no cross-correlation was permitted in the fit.
And the values for these fixed parameters are determined by the
implicit requirement that it be consistent with previous theory,
which is of course, one of the conclusions of the paper. Once
again assumptions are masquerading as conclusions.
Errors of Fit:
These four maxwellians are interpreted in terms of temperature and
densities that are used later, as seen in TETAL's figure 5. What
errors are associated with these derivative quantities? As TETAL
reply, the density is dependent on the break-points and the
temperature (width). Since one of these is fixed by the
assumptions, the density is artificially constrained within some
limits as well. Worse, the errors in the fit are compounded by
multiplying two related quantities through the unmeasured cross
terms in the covariance matrix so that we estimate (from TETAL's
figure 2 and 3) that the error in the density can be easily 100%
or greater. Worse still, TETAL compare ratios of densities which
introduce even more cross terms from the matrix. Fortunately, the
first maxwellian is fit rather well in their figure 2, though not
so in figure 3 (which fits a 3 parameter maxwellian to exactly 3
points and misses the third one), indicating that the ratio of
densities, as plotted in figure 5, has even greater compounded
error, with at least 4 cross terms contributing. Qualitatively
from their figure 5, the presence of a peak in Fuselier
[1994], whereas the lack of a peak in the CEP data indicate that
at best, this magnification of the error has completely washed out
the effect purported to be demonstrated in the figure. Since no
effort has been made to calculate the error in this density ratio,
we can only speculate on whether the peak is actually completely
absent in the CEP events.
Reliance on Moments:
This desire to discuss moments of the distribution, rather than
the distribution itself is highly misleading. Moments, such as
averages, are used only when actual distributions are highly
regular or unavailable. Neither condition is true of this data
set. That is, claiming two distributions are similar based on
their moments can be easily disproved if the two distributions are
highly dissimilar in shape. Yet this is exactly what TETAL do, for
example, in their figure 5 where two distributions are plotted
with one consistent with a linear slope and the other possessing a
distinct peak. Yet TETAL claim the two distributions are drawn
from the same population because ``The average values of the
density ratios with 0.34% for the quasi-parallel intervals and
0.26% for the CEP intervals are similar.'' Clearly using the
moments when the distributions are available is misleading at
best.
Improper comparison of moments:
Even had the two distributions looked similar, such a conclusion
is unwarranted without, at a minimum, specifying the average
deviation of the mean, which is not given. More accurately, one
should have done a F-test whether one distribution is likely to be
produced from a random sampling of the other. Again, this is not
possible without knowing the error bars on the bins, but it seems
relatively apparent that a peaked distribution is unlikely to
become linear no matter how it is sampled. To their credit, TETAL
speculate that a biased sampling might produce a linear relation
out of a peaked distribution, but no quantitative estimate of the
size of the biasing is presented, and indeed, a quite extreme bias
apparently would be required that should invalidate the previous
conclusion that the averages were similar. Thus we see TETAL
drawing spurious conclusions without adequate statistical support,
or even attempted support. This reliance on ad hoc
speculation instead of quantitative analysis is a persistant
feature that would alone undermine any confidence in the
conclusions reached.
Erroneous error bars:
In the above discussion, we noted how a ratio of derived
quantities introduce large error bars into the analysis. TETAL
push this even further with a ratio of derived quantities from
separate spacecraft shown in their figure 6. Now we have the
additional uncertainty of the spatial correlation between WIND and
POLAR, never mind the temporal lag. Collier et al. [2001]
show that this spatial correlation grows smaller the larger the
transverse distance, and we would suspect that at least a factor
of 3 uncertainty is introduced by this method. Since the
derivation of partial pressure is never defined, we can only
assume that some parameter of Maxwellian #3 is involved, which brings in the
same errors as the above density ratios. The net result is that we
would expect several 100% error in the ratio, so not
surprisingly, we find a washed out peak in the CEP data compared,
as usual to a narrow peak from earlier work. Again, TETAL compare
moments, finding ``The average value for the CEP acceleration
efficiency ratio is 2.3± 1.9 in agreement with the result
from the quasi-parallel magnetosheath.''
Finally TETAL give us an error bar, yet clearly it is not the
error bar in the measurement, only the error bar in the last
averaging step of the plot. This is not an error bar at all but an
erroneous and misleading number, which can be seen by the ease
with which it can be reduced by using fewer bins. Indeed, one
could change the average itself by changing the number of the
bins, since the average is calculated from derived quantities, not
the data itself. Finally, a F-test comparing the two distributions
would show that in actuality, the two distributions are clearly
distinct. An eyeball test to determine this would note that the
``sigma'' of the Fuselier peak is on the order of one bin wide, and
that the peak of the CEP data is 2 bins away from the peak of the
Fuselier data, or more than 1 sigma away. This exceeds the
Rayleigh criteria of distinguishing two stars in an image, and
suggests that we do not have similar distributions.
Data-independent Conclusions:
Once again, after this prima facie disagreement, TETAL
argue that the averages are in agreement with the hypothesis that
they come from the same population. Then they go on to discuss a
bias in the data of 40%. Why this bias should not affect the
average, they never explain. They do this not once, but in their
figure 5, figure 6 and in comparison of unplotted results. ``The
average value for the O>2+ to H+ acceleration efficiency
ratio for the CEP events is 2.3±4.6, in agreement with shock
acceleration theory which predicts a ratio of 2.6''. It is
unnecessary to comment that these error bars (which we argue are
far too small) are inconsistent with support for any quantitative
theory. Yet no matter what number is derived, TETAL find it to be
consistent with their hypothesis, even when it contradicts earlier
support.
Abuse of linear regression:
In their section 5, after some preliminary discussion about Fermi
acceleration that apparently invalidates the analysis used in sections
2-4, TETAL compare two data sets on which they had performed linear
regression analysis. We quote, ``The linear regression returned a
correlation coefficient of 0.68, the same as in the study with bow
shock events above. In addition, the dependency of the exponential
spectral slope E0 from the solar wind velocity for the diffuse bow
shock ions and the CEP ions is very similar, supporting also the
argument that these ions are of the same origin.''
The use of the conjuction ``In addition'' suggests that TETAL find
a similar correlation coefficient (R) to be support for
identical distributions. Now using statistical assumptions, R2
gives the percentage of data points that fit the hypothesis of the
straight line. In other words, 46%, or less than half the data
fit the hypothesis of a straight line in the CEP data set, 43% in
the AMPTE data set. Many analysts would say that a linear
regression is only meaningful when more than half the data fit the
straight line hypothesis, or R > 70%. Neither data set is
remarkable either for its agreement with Fermi acceleration theory
or with each other. It is also highly imprudent to argue that
similar correlation coefficients should be taken as evidence of
two data sets being drawn from the same distribution.
Even more puzzling is that
neither the slope, the error in the slope, the intercept nor the
error in the intercept of the linear regression fits to the two
data sets are given, though clearly the analysis has been done,
which would be the real criterion for deciding whether the data
sets are similar. Not having the data, and unable to extract the
values from the messy overplotted data of their figure 7, we
cannot estimate the errors accurately, but we can find the slope
and intercept. From the two graphs we get:
AMPTE_E0 = 0.035(V*cos(θBV)) + 0.2
CEP_E0 = 0.0475(V*) - 6.2
Since it seems likely that the fitted error in the slope is >40%, one
might conclude that the dependence of E0 on VSW is similar in
the two plots, though of course, we cannot be sure because TETAL plot
different quantities on the abcissa of each plot, but no
effort has been expended to explain the differing offsets. This is
important, because E0 is a derived quantity, the exponential slope
of the spectrum, and should remain invariant from source region to
observation region. What these two plots indicate, is that
magnetosphere has a softer spectrum than the magnetosheath for a given
solar wind speed, so that energetic particles are less likely appear
in the magnetosphere. Since it is an enhancement in these same
particles that defines CEP events, one might argue that these data
mitigate against a bow shock model.
Since the fit must have been performed to extract R, we find the
failure to report the discrepancies in the slope and intercept to
be disengenuous at best. Unfortunately, this conclusion is
amplified by a detailed look at the way TETAL have handled the
reanalyzed data, which we discuss next.
4. Mishandled Spacecraft Data
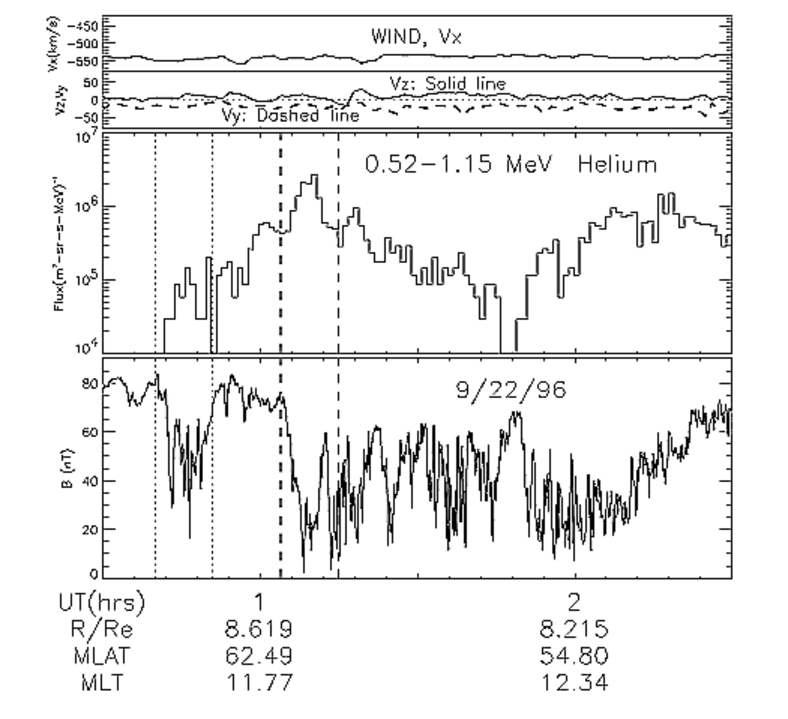
FIG 1: The CEP event on September 22, 1996. Time profiles of
solar wind velocity measured by WIND in GSE coordinates on
September 22, 1996 are plotted in the top 2 panels. Corrections
have been made for the propagation time from WIND to POLAR. The
middle panel is the spin-averaged flux of the 0.52-1.15 MeV Helium
versus time, and the bottom panel is the corresponding variation
of the local magnetic field strength, where the two dotted lines
in each panel are at 00:40 UT and 00:51 UT corresponding to
TETAL's typical event time interval and the two dashed lines in
each panel are at 1:04 UT and 1:15 UT. The distance of POLAR from
the Earth (in RE), the magnetic latitude (MLAT), and the
magnetic local time (MLT) are shown at the bottom of the figure.
Misrepresentation of reanalysis
Figure 1 plots the 9/22/96 CEP events, where the two dotted lines
are at 00:40 UT and 00:51 UT; bracketting TETAL's typical event
time interval. Note that in TETAL's paper this ``typical'' CEP
event started at 00:40 UT; however, in the CFS CEP event list,
this event started at 00:42 UT, meaning that more than 22% of the
time interval of TETAL's ``typical'' CEP event was outside the
original CEP event time interval. Now looking at the axis
of Figure 1, the event was observed at altitudes more than 8
RE in the cusp, which is different from TETAL's stated
selection criteria that ``observed at altitudes between 3.5 and 6
RE in the cusp.'' In fact, all of the CEP events reported by
CFS were measured at altitudes larger than 6.7 RE in the cusp,
as TETAL acknowlege in their Reply.
Lack of statistical correlation with solar wind
TETAL claim that the energetic ions in the CEP events are
accelerated at the quasi-parallel bowshock ``which depends on
upstream solar wind velocity''. This dependence of CEP flux on
velocity may exist over longer time intervals of days or weeks,
but does not appear to be the case in the several hour long time
interval of our analysis.
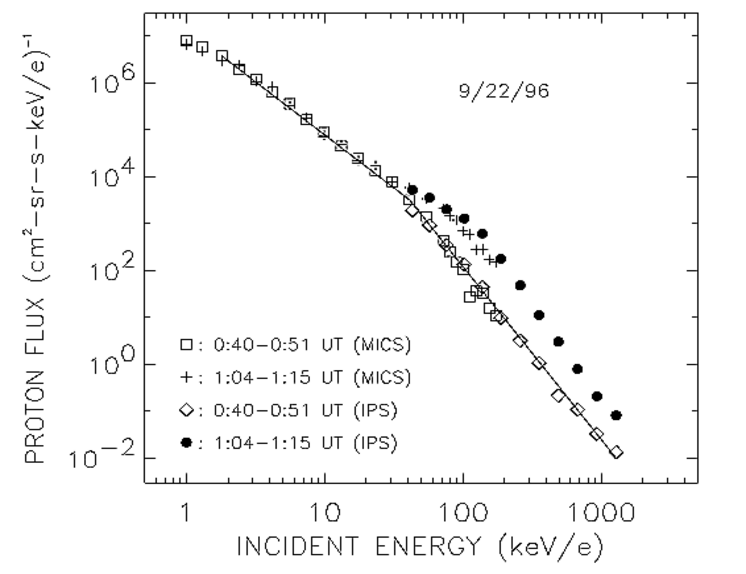
FIG 2: Proton energy spectra observed by POLAR/CAMMICE/MICS and
POLAR/CEPPAD/IPS at 0:40-0:51 UT (open squares and open diamonds) and
at 1:04-1:15 UT (pluses and solid circles) on September 22, 1996. The
double power-law line (solid line) well represents the spectrum at
0:40-0:51 UT.
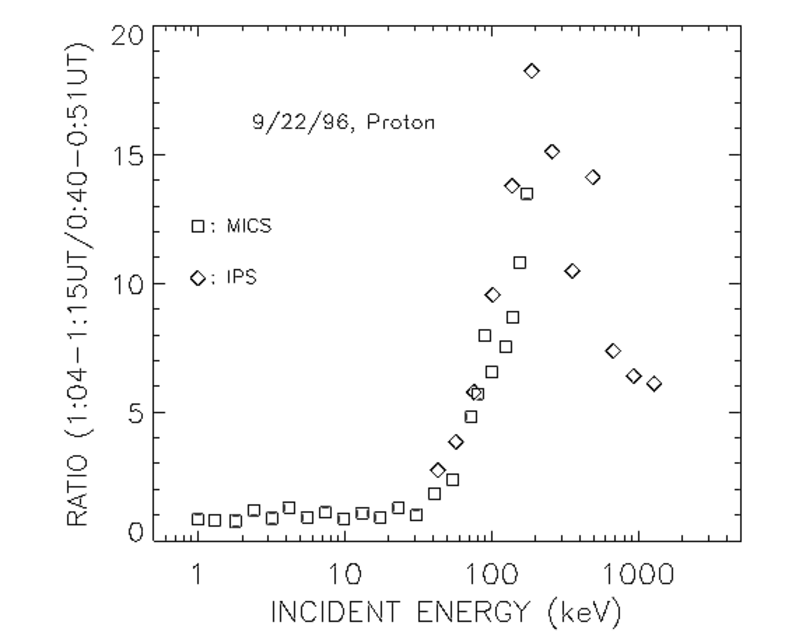
FIG 3: Intensity ratio of proton flux at 0:40-0:51 UT to proton
flux at 1:04-1:15 UT on September 22, 1996.
During the 9/22/96 CEP event period, the 0.52-1.15 MeV helium flux
was enhanced and changed by more than two orders of magnitudes
(Figure 1, middle panel), while the local magnetic field showed
diamagnetic cavities with large fluctuations (Figure 1, bottom
panel). The lower two panels display the upstream solar wind
velocity measured by the WIND spacecraft. They indicate that
during this period, the solar wind velocity was rather stable.
Figure 2 compares the proton energy spectrum at 1:04-1:15 UT
(bracketted by dashed lines in Figure 1) with that during TETAL's
``typical'' CEP event period at 0:40-0:51 UT on 9/22/96. The MICS
(Magnetospheric Ion Composition Sensor) data in Figure 2 show that
over 1-30 keV, the proton fluxes at both 0:40-0:51 UT (squares)
and 1:04-1:15 UT (pluses) were almost the same; however, at energy
> 40 keV, a higher proton flux was measured at 1:04-1:15 UT than
at 0:40-0:51 UT. The key point is that during these two periods,
the upstream solar wind velocities were almost the same (Figure
1, top panel), but the proton fluxes (at > 40 keV) exhibited a significant
difference by as large as a factor of 18 (Figure 3), demonstrating
a singular lack of correlation.
In their Reply, TETAL argue that density is also important in
upstream acceleration, which varied during this event. However
they gloss over the very real difference between velocity and
density in the Fermi acceleration model, in which velocity
increases the seed population energy, and hence is exponentially
magnified in its effect on energized particles, whereas density is
simply a linear effect. Thus a 30% increase in density hardly
explains the factor 18 higher energetic particle density. TETAL
hypothesize that connection efficiency of the reconnecting region
is responsible, but clearly this event reveals the difficulty in
reconstructing a multi-step process to account for CEP
events, so many unknowns make prediction or disproof impossible.
Nor does this reconnection refinement explain why reconnection efficiency, a
low energy particle phenomenon, should have any effect on
energetic ions in the first place. Nor why the
spectral index of E > 40keV particles for event 1 (0:40-0:51) is
substantially different from event 2 (1:04-1:15), and temporally
changing (Figure 3.)
Inapplicable model
If the quasi-parallel bow shock acceleration model mentioned by TETAL
were correct, it should energize protons from their thermalized
solar wind energy of 2 keV up to about 40 keV, not 150
keV. Conversely, if protons are energized up to 150 keV without
simultaneously energizing the E < 40keV population (Figure 3),
then the quasi-parallel bow shock acceleration model described by
TETAL is inapplicable to CEPs. Whatever the merits of bow shock
acceleration elsewhere, it doesn't apply to this data set.
Forced interpretation of data
With an inspection of
their figure 2, one finds that the observed proton spectrum at
0:40-0:51 UT on 9/22/96, in contrast to TETAL's assertion, does
not show ``breaks'' at ~10 and 150 keV/e alone, but also at
~50 keV/e. This is implicit in TETAL's analysis that used the
sum of 3 maxwellians to cover this region, with the middle
maxwellian centered around 50 keV/e. One can verify with a
straightedge, however, that a single power law will fit nicely
from 5-30 keV/e, and again from 80-150 keV/e, with an excess
residual ``bump'' centered at 50 keV/e (which grows and moves
toward higher energy as expected for a local Fermi acceleration
process, see Figure 3.) In other words, TETAL's claim that the
proton spectrum broke at ~ 10 and 150 keV/e indicating three
separate sources is artificial, better represented as a (growing)
bump at 50 keV/e superposed on a power-law tail.
Nor does our replotting of CAMMICE and IPS data (squares and
diamonds in Figure 2) find their 10 and 150 keV/e breaks,
indicating the marginal nature of their observational keystone.
Since this is likely their best ``typical'' proton spectrum, all of
their conclusions in their section 6, based upon the multiple
maxwellian fits to the breaks at ~ 10 and 150 keV/e, are
likely meaningless, and with the inability to estimate errors on
the coupled 12 fitted parameters, entirely misleading.
Adjustment of data to theory
In addition to finding spectral breaks where convenient, TETAL
miscompare data which allows better agreement
with their model. In their figure 5, larger bins for the CEP events
were compared with smaller bins in the magnetosheath, which
invalidates their conclusion 3 in section 6. In their figure 6, the
peak value for the magnetosheath was compared with the average value
for CEP events which bring it in better agreement with the theory,
invalidating their conclusion 5 in section 6. But more egregious is
their handling of the particle spectra.
TETAL stated that Chang et al. [1998] and Trattner et
al. [1999] showed that CEP spectra are very similar to ion
spectra upstream/downstream from the quasi-parallel bow shock,
``and the observed CEP spectra below 150 keV/e can be simply
explained by transporting bow shock accelerated particles from the
magnetosheath along the connected magnetic field lines into the
cusp.'' Again, as in Trattner et al. [1999], they mistakenly
compare peak upstream ion flux with averaged CEP flux. Worse, in
figure 3 of Chang et al. [1998] they present POLAR ion data
incorrectly, moving the MICS lower energy limit from 1 keV/e to
0.6 keV/e which brings the fluxes into better alignment. In
addition, they move the HIT (Heavy Ion Telescope) helium data
point on August 27, 1996 by a factor of 2 below the actual
observed value. Finally, they made no solar modulation effect
correction for 1984 AMPTE data when comparing with 1996 POLAR
data. Therefore, their conclusion, based upon their figure 3,
that ``Energetic ion fluxes downstream from the quasi-parallel bow
shock are comparable to those observed in the cusp'' is
questionable, since it appears adjusted for better
agreement with the theory.
Misrepresentation of prior work
TETAL stated that Chang et al [1998] ``found that CEP events
occurred mainly for θBn < 45°''. However, nowhere
in Chang et al.'s [1998] paper, is a ΘBn> value
stated or plotted. In fact, the only θBx (cone angle)
shown in figure 2 reveals that during the hour of ``intense ion
fluxes from 6 to 7 UT'' (CFS's CEP events), θBx >
45° for all but the first 5 minutes, necessitating a
quasi-perpendicular bow shock at the sub-solar point during the
CEP events. Now a quasi-parallel shock acceleration event may
have been occuring somewhere on the flanks of the magnetosphere,
but as Chang et al. [1998] are at pains to point out, these
conditions do not favor high energy. Thus, TETAL's claim
concerning the importance of quasi-parallel bow shock acceleration
for the observed energetic fluxes in Chang et al. [1998] is
rendered entirely irrelevant.
TETAL also stated that Trattner et al. [1999] compared two
CEP events with simultaneous observations by Geotail upstream and
downstream of the shock ``and found a remarkably good agreement
between the CEP cusp spectrum and the bow shock spectrum up to 200
keV/e''. This is entirely misleading. Trattner et al. [1999]
compared the peak (over one minute) upstream ion flux with the
averaged (over 30 minutes) cusp ion flux and even unjustifiably
increased the peak upstream ion flux by a factor of 5.3, yet the
resulting peak bow shock flux was still lower than the averaged
CEP spectrum at energies > 50 keV, indicating that the
quasi-parallel bow shock accelerated ions cannot account for the
CEPs by any stretch (see Fritz and Chen, [1999]).
5. Theoretical Support
We have so far attempted to show how TETAL's reanalysis of the data
was both mistaken and misleading. We now would like to argue without
resort to detailed analysis that the CFS hypothesis is superior to
that of TETAL because of what it attempts to prove (rather than
disprove).
TETAL's second conclusion (from the abstract) was that no local
acceleration mechanism was operating in the cusp. They present a
weak theoretical argument against local acceleration, but rely
almost completely on experimental evidence for an alternative
mechanism to discredit local acceleration. Their theoretical
argument is that CEP power-law spectra show a break at 150 keV/e
indicative of two populations. Thus, ``it is unlikely that a
single cusp acceleration process will be able to produce two
distinctly different energetic cusp distributions.''
We demur that nothing is more likely. Even bow-shock (a.k.a.
Fermi) acceleration will show a break in the power law tail at
sufficiently high energies, if for no other reason than the
gyroradii of the energizing particles become larger than the
containment volume, and the acceleration efficiency drops
precipitously. Thus a break, per se, is not evidence of two
populations. But note that such limits always produce a convex
break in the power-law tail, indicative of a spatially limited
single acceleration process. In agreement with TETAL, a concave
bend in the power law tail is strong evidence of a second
population. The mistake in TETAL is that by ignoring the pattern
of breaks--concave, convex, concave--they misidentify the second
population as occurring above 150 keV/e, rather than centered at
50keV/e and growing (see Figures 2 and 3). That is, they attribute
this peak to two separate populations because it produces 2
concave breaks, which seems unlikely given that both populations
would have to increase together to simulate a single peak.
This is a crucial point, and perhaps the source of TETAL's
confusion. We do not doubt that bow shock acceleration is occuring
and may supply energetic particles to the magnetosphere. We have
never claimed that bow-shock accelerated particles could not
penetrate the magnetopause. It may even be the source of the
background power-law tail which precedes CEP events. But a CEP
event is characterized by a large enhancement, observed to
temporally increase, of the energetic particles above a threshold
cutoff energy (~60 keV/e in Figure 2 and 3), which cannot be
accounted for in the upstream region, nor by classical
quasi-parallel bow shock acceleration (which must begin with a
seed population around 2 keV/e). When one subtracts the background
spectrum from the enhancement (Figure 3), it becomes immediately
apparent that an energetic peak far above the solar wind 2 keV/e
is responsible. Such isolated peaks have frequently if not
exclusively been assigned a single, local acceleration mechanism
in the past by countless investigators. Thus TETAL's theoretical
objections do not stand.
Nor will TETAL's experimental objections bear much scrutiny, for
as we argued above in section 1, TETAL will have a difficult time
empirically proving the logical non-existence of any phenomenon
even if they had done their analysis correctly. However, TETAL
actually undermine their position in their section 5, where they
glibly point out that Fermi acceleration, the mechanism they
propose for bow-shock acceleration, produces a power-law spectrum,
not a Maxwellian. Thus the 4 Maxwellian fit to the spectrum of
TETAL's sections 2-4 must be an approximation. Worse still, the
power law distribution for energetic particles as described by
CFS, is precisely the distribution expected if Fermi acceleration
were occurring locally, say, from a shrinking diamagnetic cavity.
Thus TETAL have inadvertantly supplied a theory in support of
local acceleration.
Furthermore, their model to replace local acceleration involves a
highly unlikely 5 step process, beginning with 1) an acceleration
outside the bowshock where the magnetic field is quasi-parallel to
the shock normal, 2) a transport through the turbulent
magnetosheath to a specified location on the magnetopause, 3) an
energy and species dependent penetration across the magnetopause
possibly mediated by an unspecified magnetic reconnection
mechanism, 4) a transport along field lines through the
magnetosphere, (which in Blake [1999] can also be a chaotic
wandering across field lines), and finally 5) a simultaneous
leakage of magnetospheric populations from low latitude dipole
trapped populations to the high latitude cusp in such a way that
the ``spectral breaks are consistent with observations in the
quasi-parallel magnetosheath''. Note that this 5-step process has
to occur in a time-synchronized fashion, in highly localized
diamagnetic cavities with extremely sharp boundaries that CFS has
identified as CEP events. In comparison, CFS argue for some sort
of 2 step process that can explain all the data: a) particles are
trapped inside the cusp, b) particles are locally accelerated.
It is almost fruitless to speculate on the probability of such a 5
step process producing nearly identical spectra with identical
spectral breaks in two separate CEP events, much less 75. Occam's
razor should certainly prefer a two step local acceleration mechanism
barring any theoretical reason why such local acceleration is not
permitted. Indeed, we might raise several dozen objections to such a 5
step process even without an alternative hypothesis, but one should
suffice.
As the Blake analysis demonstrates, ions of the energy observed by
CFS and characteristic of CEP, do not remain fixed on a flux tube
the way 1 keV solar wind plasma does. Indeed ∇ B-drift
dominates the motion of such ions, such that the transport
through the magnetopause or cusp is totally dominated by such
inhomogeneous magnetic fields. It is completely impossible for
ions with energies from 40-400 keV/e, localized in a region of
quasi-parallel geometry, to have followed similar paths through
the magnetopause to the magnetosphere that brings them back
together in the concentration observed in a CEP event, making
TETAL's figure 1 highly misleading. And should one argue that the
source is more broadly distributed, thereby permitting different
source regions to supply different parts of the CEP spectrum
similar to Blake's conjecture, then one must explain why a CEP
event has such abrupt boundaries. Thus TETAL's mechanism may be a
viable mechanism for supplying energetic particles to broad swaths
of the magnetosheath, but is singularly incapable of describing
any of the discrete features of CEP events.
Acknowledgments
We thank C. T. Russell for providing us the POLAR GMF data and K. Olgivie
for the WIND solar wind plasma data. This research was supported by
NASA grants NAG5-2578, NAG5-7677, NAG5-7841, and NAG5-9562.
References
Blake, J. B. Comment on ``Cusp: A new acceleration region of the
magnetosphere'' by J. Chen et al., Czech. J. Phys., 49, 675,
1999.
Chang S.-W. et al. ``Cusp energetic ions: A bow shock source'',
Geophys. Res. Lett., 25, 3739, 1998.
Chen, J., Fritz, T. A., Sheldon, R. B., Spence, H. E., Spjeldvik, W. N.,
Fennell, J. F., Livi, S., Russell, C. T., Pickett, J. S., and Gurnett, D.
A., Cusp energetic particle events: Implications for a major acceleration
region of the magnetosphere, J. Geophys. Res., 103, 69-78, 1998.
Collier, M. R., A. Szabo, W. Farrell, J. A. Slavin, R.P. Lepping,
R. Fitzenreiter, B. Thompson, D.C. Hamilton, G. Gloeckler,
G.C. Ho, P. Bochsler, D. Larson and L. Ofman, ``Reconnection
remnants in the magnetic cloud of October 18-19, 1995: A shock,
monochromatic wave, heat flux dropout and energetic ion beam'',
J. Geophys. Res., 106, 15,985-16,000, 2001.
Fritz, T.A. and J. Chen, Reply, Geophys. Res. Lett., 26, 1363,
1999.
Fuselier, S. A. ``A comparison of energetic ions in the plasma
depletion layer and the quasi-parallel magnetosheath'',
J. Geophys. Res., 99, 5855, 1994.
Sheldon, R.B., H.E. Spence, J. Sullivan, T.Fritz, J.Chen,
``The Discovery of Trapped Energetic Electrons in the Outer Cusp'',
Geophy. Res. Lett., 25, 1825, 1998.
Sheldon, R.B. ``The Consequences of Cusp Trapping'',
Eos Trans. 83(19), Spring Meet. Suppl., Abstract SM32C-08, 2002.
Silva, D. S. Data Analysis: A Bayesian Tutorial, Clarendon Press,
Oxford, 1996.
Trattner K.J., S.A. Fuselier, W.K. Peterson, and S.-W. Chang, Comment
on ``Correlation of cusp MeV helium with turbulent ULF power spectra
and its implications'' by J. Chen and T. A. Fritz,
Geophys. Res. Lett. 26, 1361, 1999.
Trattner, K.J., S.A. Fuselier, W.K. Peterson, S.-W. Chang, R. Friedel,
and M.R. Aellig, ``Origins of energetic ions in the cusp'',
J. Geophys. Res., 106, 5967-5976, 2001.
Comments?r*bs@rbsp.info
(Due to spamming, delete asterisk.)
Last Modified 9/30/03 by Rob Sheldon