First Energetic Neutral Atom Images from POLAR
M.G. Henderson, G.D. Reeves,
Los Alamos National Laboratory, Los Alamos, NM
H. E. Spence, R.B. Sheldon, A.M. Jorgensen,
Center for Space Physics, Boston University, Boston, MA
J.B. Blake, and J.F. Fennell
The Aerospace Corporation, Los Angeles, CA
15 May 1997
Energetic neutral atoms are created when energetic magnetospheric ions
undergo charge exchange with cold neutral atoms in the Earth's tenuous
extended atmosphere (the geocorona). Since they are unaffected by the
Earth's magnetic field, these energetic neutrals travel away in
straight line trajectories from the points of charge exchange. The
remote detection of these particles provides a powerful means through
which the global distribution and properties of the geocorona and ring
current can be inferred. Due to its 2x9 Re polar orbit, the
Polar spacecraft provides an excellent platform from which to observe
ENAs because it spends much of its time in the polar caps which are
usually free from the contaminating energetic charged particles that
make observations of ENAs more difficult. In this brief report, we
present the first ENA imaging results from Polar. Storm-time ENA images
are presented for a northern polar cap apogee pass on August 29, 1996
and for a southern polar cap perigee pass on October 23, 1996. As
well, we show with a third event (July 31, 1996) that ENA emissions
can also be detected in association with individual substorms.
Energetic neutral atoms (ENAs) are produced when energetic
magnetospheric ions undergo charge-exchange collisions with the
thermal neutral atoms that make up the Earths extended atmosphere (the
geocorona). This type of interaction can take place in the ring
current, the mid and auroral latitude energetic particle precipitation
zones, and within the low altitude equatorial ion belt (Hovestadt
et al. [1972], Moritz [1972]) that is itself formed by
ionization of earthward directed ENAs via collisions in the low
altitude equatorial atmosphere. Once an energetic neutral atom is
created, it moves away in a straight-line trajectory from the point of
charge exchange and can therefore be detected remotely by an
appropriately instrumented spacecraft. Since these neutrals are
continuously being emitted from the charge exchange regions in all
directions with energies and fluxes directly dependent upon the
properties of the ions and geocorona, they carry important information
on the global characteristics of both the geocorona and the
magnetospheric ion population.
The study of ENAs in the Earth's magnetosphere has had a long
history. The earliest evidence that energetic hydrogen exists in the
near-earth space environment came from observations of hydrogen
emission lines in auroral spectra made by Vegard [1939]. Later
on, following the discovery of the radiation belts and ring current
and the dynamics associated with geomagnetic storms, many researchers
came to the conclusion that ENA-producing charge exchange processes
were an important mechanism for the decay of the storm-time ring
current (e.g., see Roelof et al. [1985]). The first suggestion
that ENAs emitted from the radiation belts and ring current could be
used to remotely sense the magnetospheric energetic ion population was
made by Hovestadt and Scholer, [1976], and the first global
image of ENA emissions was produced by Roelof [1987] from data
acquired by the ISEE 1 spacecraft. Also, the first composition
measurments of ENAs have been reported recently by Lui et al.
[1996]. See Williams et al. [1992] for a more comprehensive
and detailed review of ENA imaging (as well as other types of
magnetospheric imaging).
In this brief report we present the first ENA imaging results from the
Polar spacecraft.
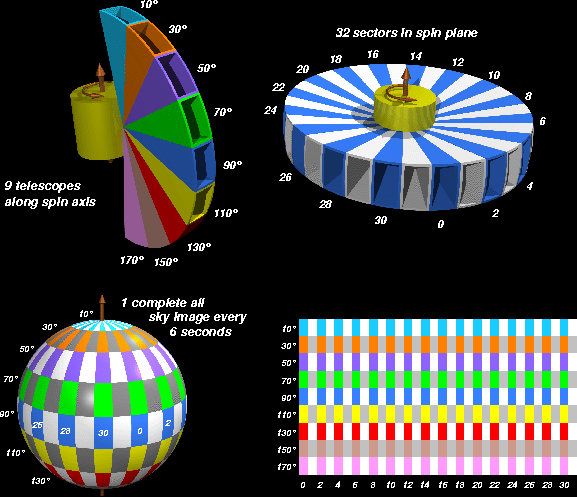
The data presented here were acquired with the Imaging Proton
Spectrometer (IPS) which is part of the Comprehensive Energetic
Particle and Pitch Angle Distribution (CEPPAD) experiment on
Polar. The IPS measures protons with energies in the range 20-1500 keV
in 16 energy channels over 9 separate polar-angle look directions
simultaneously. As shown in figure 1, the central look-directions for
the 9 detectors are arranged to be at 10o, 30o,
50o, 70o, 90o, 110o,
130o, 150o, and 170o with respect to
the spin axis and each detector has a field of view of 20o
in the polar direction by 11.25o in the azimuthal direction
which gives IPS a combined instantaeous field of view of
180ox11.25o. For the integral energy channels
(which are used here) the counts are accumulated into 32 sectors per
spin (16 for the 10o and 170o detectors\). Note
that because the detectors rotate through 11.25o during the
accumulation interval, the effective angular response in the azimuthal
direction for each sector is actually wider than
11.25o. For a detailed description of the IPS instrument
see Blake et al. [1995].
Since the IPS cannot distinguish between ions and neutrals, ENAs can
only be reliably identified when the flux of charged particles is very
low. Fortunately, due to its highly elliptical polar orbit, Polar
spends much of its time in the polar caps where this condition is
usually met.

Figure 1: Schematic diagram illustrating how the nine IPS telescopes
are oriented with respect to the spin axis.

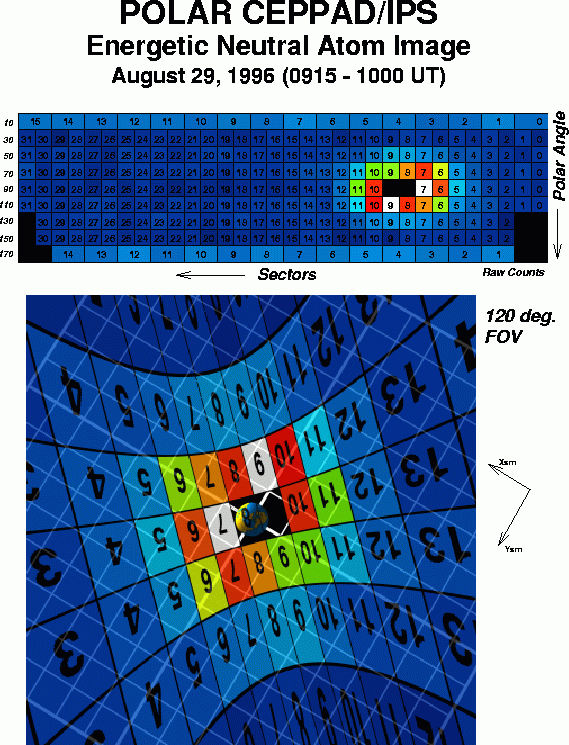
Figure 2: Storm-time ENA imaging on August 29, 1996. In (a), the IPS
spectrogram from the 50o detector is shown along with the
(integral energy channel) sector vs. time plots from the 50, 70, 90
110, and 130o detectors. An angle-angle plot (i.e., a
polar-angle versus azimuthal-angle plot) constructed from this data is
shown in (b). (c) shows the attitude and location of Polar in its
orbit at 0937:30 UT in the solar magnetic coordinate system. The white
mesh represents the SM X-Y plane and the positive x-axis is marked
with a red line. The view that IPS (and each of the individual
sectors) has of the Earth at 0937:30 UT is shown in (d). The final two
panels show the resulting ENA image in a true projection (e) and in an
equatorial SM plane projection (f).

Figure 3: Storm-time ENA emissions during a southern polar
cap pass on October 23, 1996.
Storm-time ENAs: August 29, 1996
In figure 2 we present observations of ENAs which were detected by the
Polar CEPPAD/IPS instrument during a magnetic storm that occurred on
August 29, 1996. The uppermost panel in figure 2a shows the (spin
averaged) spectrogram from the 50o detector while the next
5 panels show the (integral energy channel) sector vs. time plots from
the 50-130o detectors. In the lower-most panel, the radial
distance (R), L-shell value (L), and magnetic local time (MLT) of
Polar are also plotted as a function of time.
Since the orbital period of Polar is ~18 hours, the data presented in
this 24-hour plot format represents more than one orbit. At the
beginning of the day, Polar was situated ~6 Re above the SM X-Y
plane in the afternoon sector and was moving down toward perigee over
the southern polar cap. The radiation belt/ring current ions were
observed from 0000-0400 UT and from ~0420 UT up until ~0645 UT. After
this time, Polar entered the northern polar cap and remained there for
many hours up until ~1700 UT at which time it re-entered the ring
current/radiation belt regions on its way toward a second southern
polar cap perigee pass.
Except for a series of relatively short-lived low-flux bursts of
protons, the polar cap field lines were essentially devoid of
significant charged particle fluxes. As mentioned earlier, this
situation allows us to readily identify ENAs when they are present in
sufficient numbers. In figure 2a, the enhanced storm-time ENAs can be
seen as slightly inclined fuzzy horizontal bands in the northern polar
cap (see arro ws). Strong confirmation that these bands are indeed
ENAs comes from the fact that the Polar CAMMICE/MICS instrument, which
only measures charged particles (it rejects neutrals), did not see
them. In addition to the ENA signatures in figure 2a, the response of
the IPS to Earth light - which is always observed regardless of
whether or not ENAs are present - can be seen in the 90o
detector throughout the polar cap. This Earth response also shows up
in the 70 and 110o detectors when Polar is nearer to the
Earth (e.g., prior to ~0900 UT and after ~1600UT) due to the fact that
the Earth fills more of the field of view at such times. Note that the
ENAs are only observed when the detectors are looking toward regions
near the Earth.
Figure 2b shows an angle-angle plot (polar-angle vs. azimuth angle)
constructed by integrating the IPS integral energy channel counts over
the time period between 0915 and 1000 UT. This time span was chosen
because it had a particularly low background of charged particle
counts and because Polar was nearing apogee where the viewing geometry
changes only very gradually with time. In this format, the directions
from which the ENAs arrive in the spacecraft reference frame are most
easily seen. The Earth response shows up in sectors 8 and 9 of the
90o detector while the sun response shows up in sectors 0,
1, 30, and 31 of the 130-170o detectors. In order to
enhance the visibility of the ENA fluxes, all of the Earth and Sun
contaminated pixels have been blanked out.
To additionally orient the reader, the location and attitude of Polar
(at 0937:30 UT) is illustrated in figure 2c as it is approaching
apogee. In this figure, the 2x2 Re white mesh represents the
solar magnetic (SM) X-Y plane where the positive X-axis
is marked with a red line and the positive Y-axis is located in
the lower right hand corner. The Earth is shown at the center of
this mesh and the orbit and spin axis of Polar are shown as
the copper-colored tubing. The blue and green sphere around Polar
indicates where each of the sectors we0re pointing at 0937:30
UT.
Note that while the detectors make a complete revolution once per spin
period, the sectors into which the counts are accumulated do not. The
start of sector zero always occurs when the sun is (approximately)
between sectors 31 and 0, so the sector patterns do shift in time but
only as a function of the orbital motion and not as a function of the
spin phase. The view that IPS has of the Earth at 0937:30 UT is shown
in figure 2d. Each sector is annotated with its sector number and a
letter identifying the associated detector (`a' for the
10o; 'f' for the 170o detector). As noted
above, at 0937:30 UT the Earth lies in sectors 8 and 9 of the
90o detector.
A true projection ENA image derived from the angle-angle plot shown in
figure 2b is shown in figure 2e in the same format as figure 2d. As
expected, due to the build-up of an enhanced storm-time ring current
during this event, a ring of enhanced ENA emissions is observed to
encircle the Earth out to radial distances near geosynchronous
orbit. The same data is also presented in an equatorial SM plane
projection in figure 2f with the bowshock, magnetopause, and
geosynchronous orbit shown for reference. The color bar associated
with this plot also applies to the true projection image shown in
figure 2e and to the angle-angle plot shown in figure 2b.
Storm-time ENAs: October 23, 1996
In addition to the northern polar cap passes, ENAs can also be
observed during the southern polar cap perigee passes. In figure 3 we
present a sequence of four southern pass ENA images acquired during a
magnetic storm on October 23, 1996. Since Polar is so close to the
Earth during this time period the viewing geometry changes very
rapidly as a function of time. To avoid image blurring, the
integration times are necessarily shorter. But this is compensated
for by the fact that the counting rates are also much higher than they
are at apogee. Note also, that equatorial plane projections are
inappropriate for these kind of oblique viewing geometries. This
complicates the interpretation of dynamics in such cases, but the many
different projections that can be acquired over short periods of time
also provide more information on the three dimensional structure of
the charge exchange regions.
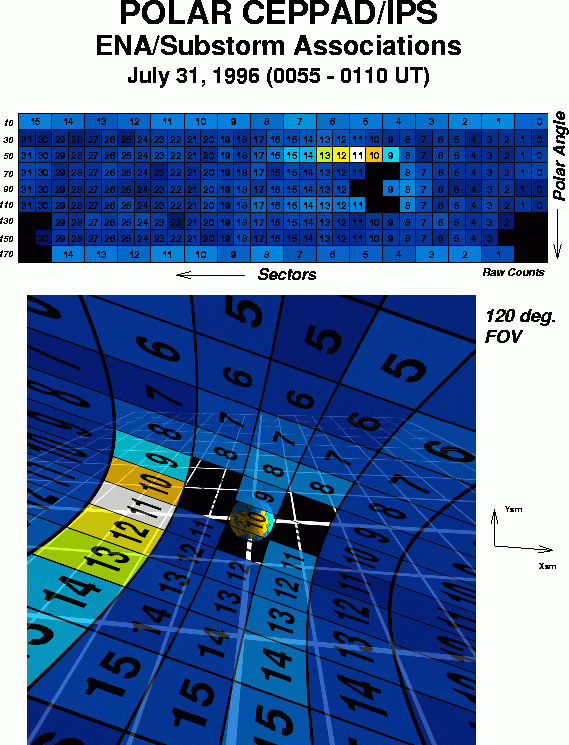
Substorm-associated ENAs: July 31, 1996
A new and unexpected result of the present study is that ENAs can also
be observed in association with individual substorms. In figure 4 we
show a sequence of ENA images acquired early on July 31, 1996 during a
magnetospheric substorm. As shown, a significant brightening of the
ENA emissions occurred on the night-side of the Earth between about 4
and 8 Re. Data from the Los Alamos Geosynchronous energetic
particle detectors shows that this brightening occurred following a
substorm-associated energetic particle injection. As well, the global
auroral imagery from the POLAR VIS instrument shows a very expanded
night-side auroral distribution consistent with the occurrence of a
magnetospheric substorm (L. Frank, pers. comm.).
From the observed fluxes of ENAs, we estimate with a very simple model
the near-equatorial ion fluxes in the source region. A rigorous
inversion of the ENA fluxes is beyond the scope of the present
analysis; rather, we seek only an order-of-magnitude estimate of the
average ion flux near 6 Re. First, we assume that the ENA
emissions come from an "optically" thin medium. With this excellent
approximation the differential ENA flux, is given by the line-of-sight
(LOS) integration
jena(E)=s int[nH(l)jion(E,l)dl],
where s is the H-H+ charge-exchange cross section,
nH is the neutral hydrogen density,
jion is the ion differential flux, E is the
particle energy, and l is the LOS path length (see Lui et
al. [1996]). We assume that the ion fluxes producing the ENAs
come from a slab with height, L = 4 Re,
centered about the magnetic equator. Within the slab we assume
that the neutral hydrogen and proton densities are
uniform. The LOS integration can then be simplified to solve for
the ion flux,
jion(E)=jena(E)(s nHL)-1.
Hodges' [1994] exospheric model is used to estimate the average
geocoronal neutral density which, at a distance of 6 Re, yields
a value of ~100 cm-3. At onset, the brightest pixel
(centered at L=6) recorded ENA differential fluxes of ~300
(cm2*s*sr*keV)-1 at 30 keV. At this energy, the
H-H+ charge-exchange cross section is estimated to be
3x10-16 cm2 (Hodges [1994]), so that the
observed differential flux of 30 keV ENAs corresponds to a 30 keV ion
differential flux of ~ 4x10⁶
(cm2*s*sr*keV)-1 in the onset
region. Differential fluxes comparable to and even considerably higher
than this estimate are observed routinely by geostationary satellites
during substorm injections. Despite the crudity of the model, this
calculation provides initial confidence that the ENA intensity
observed is consistent with the expected ion source
population.

Figure 4: Substorm-associated ENA emissions on July 31, 1996. Polar
is in the dawn sector and noon is to the right.
As demonstrated in this study, the IPS instrument on Polar can easily
detect enhanced ENA emissions from the radiation belt/ring current
regions with count rates sufficient for the construction of ENA
images. In addition, the polar orbit of the Polar spacecraft allows us
to monitor the ENA emissions continuously for many hours at a time.
The images constructed for the August 29, 1996 and October 23, 1996
events show the expected enhancement of energetic neutrals arising
from the growth and development of the storm-time ring current. And
the images constructed for the July 31, 1996 event clearly show, for
the first time, that ENAs can also be detected in response to
individual substorm injections. While an enormous amount of
information can be obtained from the raw ENA images alone, it is
important to note that they do not map out the distribution of the
energetic ion population directly. Instead, they map out the regions
of charge exchange collisions occurring between the energetic ion
population and the Earth's geocorona. This distinction is significant,
particularly in light of the fact that the geocorona is not
spherically symmetrical about the Earth; due to global variations in
the resonant scattering of Lyman alpha photons, the geocorona gets
stretched out in the anti-sunward direction and also has a smaller
bulge extending toward the dayside. In future analysis, we plan to
utilize forward modeling techniques (e.g. Roelof [1987]) in order to
infer the true distribution of energetic ions. As well, we plan to
compare animated sequences of ENA images during substorms and during
the development and decay of the storm-time ring current with global
auroral imager data, in-situ particle measurements from other ISTP
spacecraft, and ground-based observations. Spatial asymmetries and
temporal and spectral variability in the ring current will be
investigated. And we will attempt to quantify the importance of
charge exchange processes in the decay of the ring current.
Acknowledgments
We gratefully acknowledge the following key scientists and engineers who
contributed significantly to the IPS instrument: S. Imamoto, B. Johnson,
W. A. Kolasinski, D. Mabry, J. Osborn, J. Skinner, F. Hilsenrath, C. Wilbur.
This work was supported under NASA grant number S19511E.
Blake, J. B., et al. , CEPPAD experiment on POLAR,
Space Sci. Rev., 71, 531, 1995.
Hodges, R. R., Monte Carlo simulation of
the terrestrial h ydrogen exosphere,
J. Geophys. Res., 99, 23229, 1994.
Hovestadt, D., B. Hausler, and M. Scholer,
Observation of energetic particles at very low altitudes
near the geomagnetic equator,
Phys. Rev. Lett, 28, 1340, 1972.
Lui, A. T. Y., D. J. Williams, E. C. Roelof, R. W. McEntire,
and D. G. Mitchell,
First composition measurements of energetic neutrals,
Geophys. Res. Lett., 23, 2641, 1996.
Moritz, J.,
Energetic protons at low equatorial altitudes,
Z. Geophys., 38, 701, 1972.
Roelof, E. C., Energetic neutral atom image of
a storm-time ring current,
Geophys. Res. Lett., 14, 652, 1987.
Roelof, E. C., D. G. Mitc hell, and D. J. Williams,
Energetic neutral atoms (E>50 k ev) from the ring current:
IMP 7/8 and ISEE 1,
J. Geophys. Res., 90, 10991, 1985.
Vegard, L., Hydrogen showers in the auroral region,
Nature, 144, 1089, 1939.
Williams, D. J., E. C. Roelof, and D.G. Mitchell,
Global magnetospheric imaging,
Rev. Geophys., 30, 183, 1992.
TOC Comments?
r*bs@rbsp.info
(Due to spamming, delete asterisk)